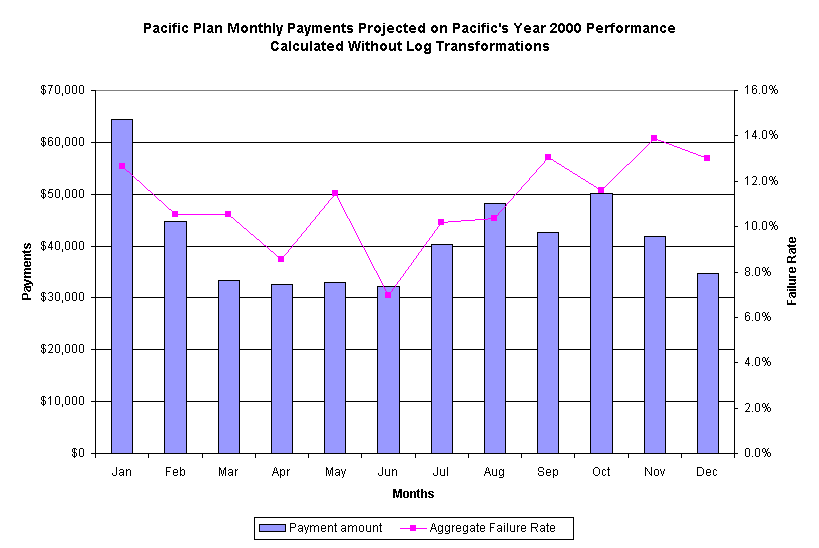
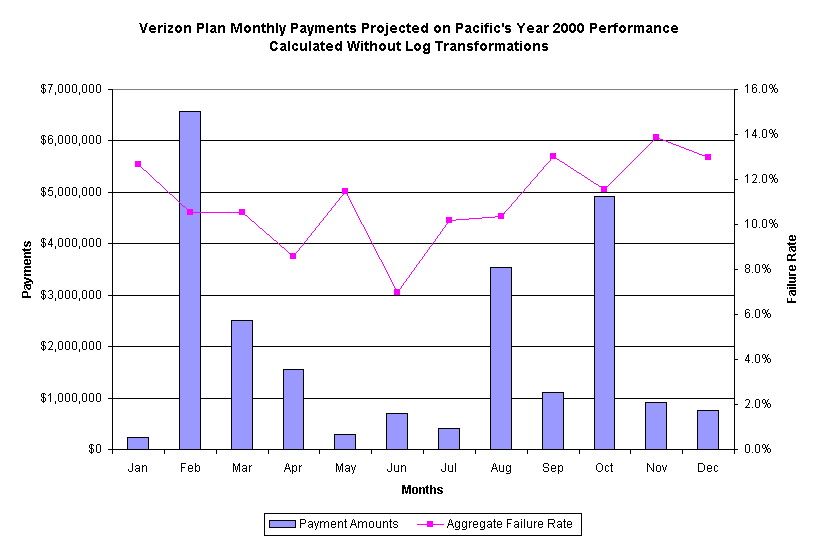
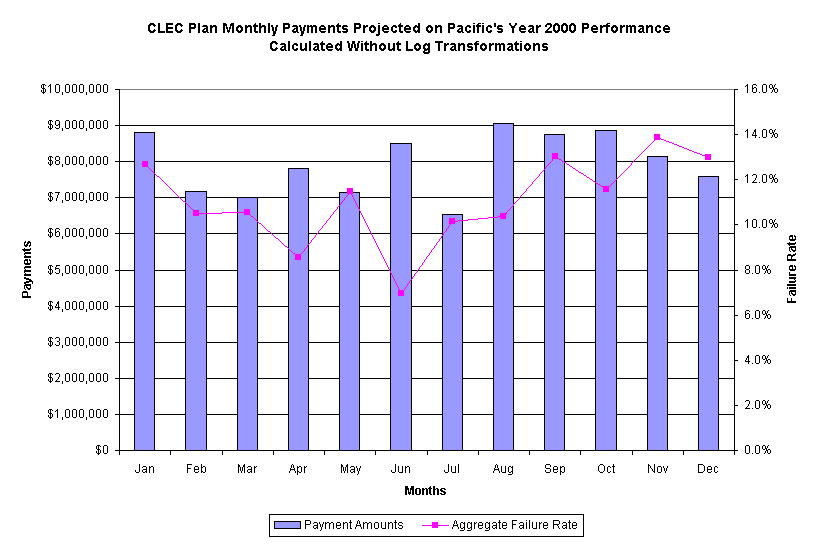
Appendix B: Payment Amounts Generated by the Proposed Plans.
Sources:
Payment amounts: Attachment to Pacific Bell Telephone Company's (U 1001 C) Opening Comments on Performance Remedies Plan (May 18, 2001). Filed May 18, 2001, Pacific Bell Telephone Company.
Graphed aggregate failure rates: Calculated by staff using program and data files provided by Pacific Bell.
5/7/2001
Results from the Pacific Plan on Real Data without Logs
Mitigation and Conditional Failure
Mitigation and No Conditional Failure
No Mitigation and Conditional Failure
No Mitigation and No Conditional Failure
Year
Month
Tier I
Tier II
Total
Tier I
Tier II
Total
Tier I
Tier II
Total
Tier I
Tier II
Total
2000
Jan
$52,400
$12,000
$64,400
$52,400
$0
$52,400
$164,300
$28,000
$192,300
$164,300
$0
$164,300
2000
Feb
$37,150
$7,500
$44,650
$37,150
$0
$37,150
$108,550
$9,500
$118,050
$108,550
$0
$108,550
2000
Mar
$28,450
$5,000
$33,450
$28,450
$0
$28,450
$82,300
$7,500
$89,800
$82,300
$0
$82,300
2000
Apr
$28,050
$4,500
$32,550
$28,050
$0
$28,050
$104,600
$6,500
$111,100
$104,600
$0
$104,600
2000
May
$28,900
$4,000
$32,900
$28,900
$0
$28,900
$96,200
$6,500
$102,700
$96,200
$0
$96,200
2000
Jun
$25,750
$6,500
$32,250
$25,750
$0
$25,750
$101,200
$9,000
$110,200
$101,200
$0
$101,200
2000
Jul
$33,300
$7,000
$40,300
$33,300
$0
$33,300
$113,650
$9,000
$122,650
$113,650
$0
$113,650
2000
Aug
$38,150
$10,000
$48,150
$38,150
$0
$38,150
$136,200
$12,000
$148,200
$136,200
$0
$136,200
2000
Sep
$34,050
$8,500
$42,550
$34,050
$0
$34,050
$128,800
$10,500
$139,300
$128,800
$0
$128,800
2000
Oct
$39,150
$11,000
$50,150
$39,150
$0
$39,150
$110,850
$13,000
$123,850
$110,850
$0
$110,850
2000
Nov
$30,900
$11,000
$41,900
$30,900
$0
$30,900
$115,650
$13,000
$128,650
$115,650
$0
$115,650
2000
Dec
$29,150
$5,500
$34,650
$29,150
$0
$29,150
$96,450
$7,500
$103,950
$96,450
$0
$96,450
Total
$405,400
$92,500
$497,900
$405,400
$0
$405,400
$1,358,750
$132,000
$1,490,750
$1,358,750
$0
$1,358,750
Avg
$33,783
$7,708
$41,492
$33,783
$0
$33,783
$113,229
$11,000
$124,229
$113,229
$0
$113,229
Results from the Pacific Plan on Real Data with Logs
Mitigation and Conditional Failure
Mitigation and No Conditional Failure
No Mitigation and Conditional Failure
No Mitigation and No Conditional Failure
Year
Month
Tier I
Tier II
Total
Tier I
Tier II
Total
Tier I
Tier II
Total
Tier I
Tier II
Total
2000
Oct
$41,750
$11,500
$53,250
$41,750
$0
$41,750
$128,200
$13,500
$141,700
$128,200
$0
$128,200
2000
Nov
$40,900
$12,000
$52,900
$40,900
$0
$40,900
$149,150
$14,000
$163,150
$149,150
$0
$149,150
2000
Dec
$38,550
$8,000
$46,550
$38,550
$0
$38,550
$123,400
$10,000
$133,400
$123,400
$0
$123,400
Total
$427,400
$96,500
$523,900
$427,400
$0
$427,400
$1,436,550
$136,000
$1,572,550
$1,436,550
$0
$1,436,550
5/11 REVISED CLEC PLAN
5/15/2001
Results from the CLEC Plan on Real Data without Logs
Mitigation and Conditional Failure
Mitigation and No Conditional Failure
No Mitigation and Conditional Failure
No Mitigation and No Conditional Failure
Year
Month
Tier I
Tier II
Total
Tier I
Tier II
Total
Tier I
Tier II
Total
Tier I
Tier II
Total
2000
Jan
$4,677,944
$4,126,673
$8,804,617
$4,640,444
$4,087,503
$8,727,947
$4,771,919
$4,126,673
$8,898,592
$4,679,337
$4,087,503
$8,766,839
2000
Feb
$3,420,514
$3,750,714
$7,171,229
$3,383,225
$3,711,466
$7,094,692
$3,546,613
$3,750,714
$7,297,327
$3,450,447
$3,711,466
$7,161,913
2000
Mar
$3,402,581
$3,600,408
$7,002,989
$3,355,144
$3,449,780
$6,804,925
$3,499,307
$3,600,408
$7,099,715
$3,417,984
$3,449,780
$6,867,765
2000
Apr
$3,990,822
$3,809,043
$7,799,866
$3,911,896
$3,754,165
$7,666,061
$4,109,129
$3,809,043
$7,918,172
$3,969,809
$3,754,165
$7,723,974
2000
May
$4,108,831
$3,033,594
$7,142,426
$4,077,224
$3,020,808
$7,098,033
$4,201,633
$3,033,594
$7,235,228
$4,129,394
$3,020,808
$7,150,203
2000
Jun
$4,553,750
$3,953,712
$8,507,462
$4,464,562
$3,927,309
$8,391,871
$4,683,618
$3,953,712
$8,637,330
$4,547,229
$3,927,309
$8,474,538
2000
Jul
$3,395,739
$3,132,964
$6,528,703
$3,341,272
$3,080,467
$6,421,739
$3,516,469
$3,132,964
$6,649,434
$3,405,554
$3,080,467
$6,486,021
2000
Aug
$4,584,810
$4,480,216
$9,065,026
$4,494,537
$4,277,437
$8,771,974
$4,781,330
$4,480,216
$9,261,546
$4,598,029
$4,277,437
$8,875,467
2000
Sep
$4,570,444
$4,179,979
$8,750,423
$4,524,723
$4,152,586
$8,677,308
$4,706,468
$4,179,979
$8,886,447
$4,588,281
$4,152,586
$8,740,867
2000
Oct
$4,083,838
$4,786,303
$8,870,141
$4,000,724
$4,661,303
$8,662,028
$4,201,199
$4,786,303
$8,987,502
$4,060,651
$4,661,303
$8,721,954
2000
Nov
$3,810,718
$4,339,456
$8,150,174
$3,651,799
$4,298,232
$7,950,031
$3,939,890
$4,339,456
$8,279,345
$3,744,905
$4,298,232
$8,043,136
2000
Dec
$4,045,131
$3,532,986
$7,578,117
$3,974,544
$3,520,399
$7,494,944
$4,136,295
$3,532,986
$7,669,281
$4,023,263
$3,520,399
$7,543,662
Total
$48,645,123
$46,726,049
$95,371,173
$47,820,095
$45,941,456
$93,761,551
$50,093,869
$46,726,049
$96,819,919
$48,614,883
$45,941,456
$94,556,339
Results from the CLEC Plan on Real Data with Logs
Mitigation and Conditional Failure
Mitigation and No Conditional Failure
No Mitigation and Conditional Failure
No Mitigation and No Conditional Failure
Year
Month
Tier I
Tier II
Total
Tier I
Tier II
Total
Tier I
Tier II
Total
Tier I
Tier II
Total
2000
Oct
$4,475,533
$5,300,023
$9,775,556
$4,372,795
$5,170,322
$9,543,116
$4,618,196
$5,300,023
$9,918,220
$4,440,998
$5,170,322
$9,611,320
2000
Nov
$4,757,330
$4,924,324
$9,681,653
$4,654,107
$4,884,769
$9,538,877
$4,898,140
$4,924,324
$9,822,463
$4,723,539
$4,884,769
$9,608,309
2000
Dec
$4,695,756
$4,078,302
$8,774,058
$4,543,414
$3,887,470
$8,430,884
$4,821,681
$4,078,302
$8,899,983
$4,616,838
$3,887,470
$8,504,308
Total
$50,634,054
$48,369,953
$99,004,007
$49,763,343
$47,404,084
$97,167,427
$52,154,504
$48,369,953
##########
$50,567,441
$47,404,084
$97,971,525
5/4/2001
Results from the ORA Plan on Real Data without Logs
Year
Month
Mitigation and Conditional Failure
Mitigation and No Conditional Failure
No Mitigation and Conditional Failure
No Mitigation and No Conditional Failure
2000
Jan
$480,359
$480,359
$480,359
$480,359
2000
Feb
$6,195,173
$6,195,173
$6,195,173
$6,195,173
2000
Mar
$14,651,867
$14,651,867
$14,651,867
$14,651,867
2000
Apr
$8,286,242
$8,286,242
$8,286,242
$8,286,242
2000
May
$1,447,820
$1,447,820
$1,447,820
$1,447,820
2000
Jun
$783,058
$783,058
$783,058
$783,058
2000
Jul
$1,274,248
$1,274,248
$1,274,248
$1,274,248
2000
Aug
$689,755
$689,755
$689,755
$689,755
2000
Sep
$13,232,020
$13,232,020
$13,232,020
$13,232,020
2000
Oct
$2,472,857
$2,472,857
$2,472,857
$2,472,857
2000
Nov
$1,957,299
$1,957,299
$1,957,299
$1,957,299
2000
Dec
$1,003,870
$1,003,870
$1,003,870
$1,003,870
Total
$52,474,567
$52,474,567
$52,474,567
$52,474,567
Results from the ORA Plan on Real Data with Logs
Year
Month
Mitigation and Conditional Failure
Mitigation and No Conditional Failure
No Mitigation and Conditional Failure
No Mitigation and No Conditional Failure
2000
Oct
$2,687,169
$2,687,169
$2,687,169
$2,687,169
2000
Nov
$2,345,315
$2,345,315
$2,345,315
$2,345,315
2000
Dec
$2,238,154
$2,238,154
$2,238,154
$2,238,154
Total
$54,311,179
$54,311,179
$54,311,179
$54,311,179
5/17/2001
Results from the Verizon Plan on Real Data without Logs
Mitigation and Conditional Failure
Mitigation and No Conditional Failure
No Mitigation and Conditional Failure
No Mitigation and No Conditional Failure
Year
Month
Tier I
Tier II
Total
Tier I
Tier II
Total
Tier I
Tier II
Total
Tier I
Tier II
Total
2000
Jan
$239,916
$1,978
$241,894
$239,916
$0
$239,916
$249,327
$1,978
$251,305
$249,327
$0
$249,327
2000
Feb
$6,576,514
$1,160
$6,577,674
$6,576,514
$0
$6,576,514
$8,927,055
$1,160
$8,928,215
$8,927,055
$0
$8,927,055
2000
Mar
$2,499,795
$721
$2,500,516
$2,499,795
$0
$2,499,795
$2,691,077
$721
$2,691,798
$2,691,077
$0
$2,691,077
2000
Apr
$1,548,027
$675
$1,548,702
$1,548,027
$0
$1,548,027
$5,413,374
$675
$5,414,049
$5,413,374
$0
$5,413,374
2000
May
$297,482
$575
$298,057
$297,482
$0
$297,482
$562,944
$575
$563,519
$562,944
$0
$562,944
2000
Jun
$699,323
$953
$700,276
$699,323
$0
$699,323
$703,571
$953
$704,524
$703,571
$0
$703,571
2000
Jul
$414,511
$1,145
$415,656
$414,511
$0
$414,511
$397,468
$1,145
$398,614
$397,468
$0
$397,468
2000
Aug
$3,546,966
$1,596
$3,548,562
$3,546,966
$0
$3,546,966
$3,507,712
$1,596
$3,509,308
$3,507,712
$0
$3,507,712
2000
Sep
$1,107,414
$1,347
$1,108,761
$1,107,414
$0
$1,107,414
$1,021,098
$1,347
$1,022,445
$1,021,098
$0
$1,021,098
2000
Oct
$4,918,657
$1,695
$4,920,352
$4,918,657
$0
$4,918,657
$4,661,707
$1,695
$4,663,402
$4,661,707
$0
$4,661,707
2000
Nov
$911,677
$1,719
$913,396
$911,677
$0
$911,677
$701,546
$1,719
$703,265
$701,546
$0
$701,546
2000
Dec
$753,999
$851
$754,850
$753,999
$0
$753,999
$533,647
$851
$534,498
$533,647
$0
$533,647
Total
$23,514,281
$14,414
$23,528,695
$23,514,281
$0
$23,514,281
$29,370,526
$14,414
$29,384,940
$29,370,526
$0
$29,370,526
Results from the Verizon Plan on Real Data with Logs
Mitigation and Conditional Failure
Mitigation and No Conditional Failure
No Mitigation and Conditional Failure
No Mitigation and No Conditional Failure
Year
Month
Tier I
Tier II
Total
Tier I
Tier II
Total
Tier I
Tier II
Total
Tier I
Tier II
Total
2000
Oct
$4,968,175
$1,772
$4,969,947
$4,968,175
$0
$4,968,175
$4,727,610
$1,772
$4,729,382
$4,727,610
$0
$4,727,610
2000
Nov
$970,826
$1,875
$972,701
$970,826
$0
$970,826
$694,587
$1,875
$696,462
$694,587
$0
$694,587
2000
Dec
$835,328
$1,237
$836,565
$835,328
$0
$835,328
$595,984
$1,237
$597,221
$595,984
$0
$595,984
Total
$23,704,276
$15,034
$23,719,311
$23,704,276
$0
$23,704,276
$29,491,807
$15,034
$29,506,841
$29,491,807
$0
$29,491,807
5/17/2001
Results from Simulated Data
Mitigation and Conditional Failure
Mitigation and No Conditional Failure
No Mitigation and Conditional Failure
No Mitigation and No Conditional Failure
Scenario
Tier I
Tier II
Total
Tier I
Tier II
Total
Tier I
Tier II
Total
Tier I
Tier II
Total
Pacific
A
$10,486
$28
$10,514
$10,486
$0
$10,486
$67,656
$1,167
$68,822
$67,656
$0
$67,656
B
$145,775
$47,333
$193,108
$145,775
$0
$145,775
$409,867
$74,000
$483,867
$409,867
$0
$409,867
C
$772,194
$420,667
$1,192,861
$772,194
$0
$772,194
$2,119,675
$462,222
$2,581,897
$2,119,675
$0
$2,119,675
D
$5,905,283
$1,510,222
$7,415,506
$5,905,283
$0
$5,905,283
$8,850,008
$1,538,667
$10,388,675
$8,850,008
$0
$8,850,008
Mitigation and Conditional Failure
Mitigation and No Conditional Failure
No Mitigation and Conditional Failure
No Mitigation and No Conditional Failure
Scenario
Tier I
Tier II
Total
Tier I
Tier II
Total
Tier I
Tier II
Total
Tier I
Tier II
Total
CLEC
A
$2,672,580
$574,900
$3,247,479
$2,564,531
$528,879
$3,093,410
$2,935,031
$574,900
$3,509,931
$2,722,515
$528,879
$3,251,394
B
$7,282,435
$7,116,099
$14,398,534
$6,993,435
$6,988,307
$13,981,742
$7,552,789
$7,116,099
$14,668,888
$7,162,742
$6,988,307
$14,151,049
C
$12,289,368
$13,733,851
$26,023,218
$11,748,467
$13,258,808
$25,007,275
$12,585,647
$13,733,851
$26,319,498
$11,939,778
$13,258,808
$25,198,586
D
$22,509,064
$26,361,808
$48,870,872
$21,393,516
$25,674,070
$47,067,586
$22,834,535
$26,361,808
$49,196,343
$21,615,928
$25,674,070
$47,289,998
Scenario
Mitigation and Conditional Failure
Mitigation and No Conditional Failure
No Mitigation and Conditional Failure
No Mitigation and No Conditional Failure
ORA
A
$65,329
$65,329
$65,329
$65,329
B
$401,540
$401,540
$401,540
$401,540
C
$639,355
$639,355
$639,355
$639,355
D
$1,250,400
$1,250,400
$1,250,400
$1,250,400
Mitigation and Conditional Failure
Mitigation and No Conditional Failure
No Mitigation and Conditional Failure
No Mitigation and No Conditional Failure
Scenario
Tier I
Tier II
Total
Tier I
Tier II
Total
Tier I
Tier II
Total
Tier I
Tier II
Total
Verizon
A
$81,835
$0
$81,835
$81,835
$0
$81,835
$200,591
$0
$200,591
$200,591
$0
$200,591
B
$3,343,006
$3,603
$3,346,609
$3,343,006
$0
$3,343,006
$2,355,210
$3,603
$2,358,813
$2,355,210
$0
$2,355,210
C
$6,281,303
$7,656
$6,288,959
$6,281,303
$0
$6,281,303
$4,507,864
$7,656
$4,515,520
$4,507,864
$0
$4,507,864
D
$12,929,103
$14,697
$12,943,800
$12,929,103
$0
$12,929,103
$8,535,089
$14,697
$8,549,786
$8,535,089
$0
$8,535,089
4/26/2001
Failure Rates by Scenario
Scenario
Miss
Chronic
Extended
A
7%
0.30%
0.02%
B
14%
5%
3%
C
23%
11%
8%
D
38%
21%
14%
Note:
Miss
Average percentage of observations missed using a 10% alpha for parity measures and the Interim Decision rules for benchmarks
Chronic
The percentage of observations missed for three (or more) consecutive months
Extended
The percentage of observations missed for six (or more) consecutive months
Note: The charts on this and following pages have different vertical scales for payment amounts. The payment amounts differ greatly between plans, and to illustrate each plan's month-to-month variability it was necessary to graph the results on separate charts. The percentage-failure scales on the right side of each graph are the same for all graphs.