PUBLIC UTILITIES COMMISSION OF THE STATE OF CALIFORNIA
ENERGY DIVISION RESOLUTION E-4272
October 15, 2009
Resolution E-4272. Energy Efficiency 2006-2008 Interim Verification Report.
PROPOSED OUTCOME: This resolution adopts the interim Verification Report prepared by the Energy Division to verify the costs and installations of the Investor Owned Utilities' energy efficiency program activities during the 2006-2008 program period.
ESTIMATED COST: None.
__________________________________________________________
SUMMARY
The 2006-2008 Verification Report Issued by Energy Division Is Adopted
As ordered by D. 08-12-059, Energy Division is issuing the Energy Efficiency 2006-2008 Verification Report as a Resolution for adoption by the California Public Utilities Commission. The Verification Report and associated appendices are attached to and incorporated in this Resolution.
BACKGROUND
In Decisions 07-09-043 and 08-01-042, the California Public Utilities Commission adopted a Risk/Reward Incentive Mechanism (RRIM) to encourage the utilities to invest in energy efficiency. The mechanism enables the investor owned utilities to earn rewards on energy efficiency programs in amounts comparable to what the companies would otherwise earn through supply side investments. The Decisions establish a performance standard for the utilities, under which the utilities earn incentives if their energy efficiency program portfolios achieve certain quantitative energy efficiency savings goals.
Under the process adopted in Decisions 07-09-043 and 08-01-042, Energy Division is required to verify the costs and installations of the energy efficiency program activities, update the ex-ante parameters used to estimate program savings and benefits, and publish reports that calculate the earnings the utilities are eligible to claim. There are two interim earnings claims during the 2006-2008 three-year program cycle that are "progress payments" towards total expected earnings, and one final "true-up" payment after the program cycle is completed.
On November 18, 2008, Energy Division issued a draft version of the Energy Efficiency 2006-2007 Verification Report. Energy Division held a workshop on the Report on December 5, 2008, at which comments were received from the regulated utilities and stakeholders. Energy Division revised the Verification Report in response to comments received at the workshop and in writing, and corrected errors identified by Energy Division, the utilities, and stakeholders.
n December 18, 2008, the Commission adopted Decision (D.) 08-12-059, which modified the process for the issuance of Energy Division's verification reports. In Ordering Paragraph 6 of that decision, the Commission directed Energy Division to issue all verification reports via draft resolution that includes detailed information regarding the underlying assumptions relied upon as well as supporting information and documentation that provides the basis for those assumptions. Ordering Paragraph 8 of the same decision modified the process adopted in Attachment 7 of D.07-09-043 for public vetting and comments on Energy Division's draft Verification Report. Specifically, the Commission directed Energy Division to issue the draft Verification report via a draft resolution that will be served on all appropriate service lists and for stakeholders to provide written comments to Energy Division identifying any errors in the draft report via the formal comments submitted on the draft resolution and subject to appropriate rules of practice and procedures. Ordering Paragraph 7 of the same decision further directed that the Energy Division verification report covering the 2006-2007 interim claims be issued by resolution no later than January 15, 2009. Pursuant to Executive Director's order, Energy Division issued the revised 2006-2007 Verification Report on February 5, 2009.
Energy Division is issuing its second Interim Verification Report for 2006-2008 through the resolution process as directed by the Commission in D. 08-12-059. The second Interim Verification Report and associated appendices are attached to this Resolution and incorporated by reference.
COMMENTS
Public Utilities Code section 311(g)(1) provides that this resolution must be served on all parties and subject to at least 30 days public review and comment prior to a vote of the Commission. Section 311(g)(2) provides that this 30-day period may be reduced or waived upon the stipulation of all parties in the proceeding.
The 30-day comment period for the draft of this resolution was neither waived or reduced. Accordingly, the draft resolution was mailed to parties for comments on August 6, 2009, and placed on the Commission's agenda more than 30 days from that date.
Written comments were submitted by stakeholders on the second draft verification report. Those comments and responses to the comments by the Energy Division are included in Section 9 of the Verification Report attached to this Resolution.
FINDINGS
1. In D.08-12-059, the Commission directed Energy Division to issue its draft Verification Report via draft resolution that includes detailed information regarding the underlying assumptions relied upon as well as supporting information and documentation that provides the basis for those assumptions.
2. D.08-12-059 modified the process adopted in Attachment 7 of D.07-09-043 for public vetting and comments on Energy Division's draft Verification Report. Specifically, the Commission directed Energy Division to issue the draft Verification Report via a draft resolution to be served on all appropriate service lists. Stakeholders had the opportunity to provide written comments to Energy Division identifying any errors in the draft Verification Report via the formal comments submitted on the draft resolution and subject to appropriate rules of practice and procedures.
3. The 30-day comment period for the draft of this resolution was neither waived or reduced. Accordingly, the draft resolution was mailed to parties for comments on August 6, 2009, and was placed on the Commission's agenda more than 30 days from that date.
4. Energy Division has prepared responses to written comments submitted by stakeholders on the draft 2006-2008 Verification Report. Those comments are included in Section 9 of the Verification Report attached to this Resolution.
5. Energy Division has corrected errors or omissions in the draft 2006-2008 Verification Report, and a list of those changes is included in Section 9 of the Verification Report attached to this Resolution.
THEREFORE IT IS ORDERED THAT:
1. The Energy Efficiency Verification Report for 2006-2008 is adopted by the Public Utilities Commission of the State of California.
This Resolution is effective today.
I certify that the foregoing resolution was duly introduced, passed and adopted at a conference of the Public Utilities Commission of the State of California held on October 15, 2009, the following Commissioners voting favorably thereon:
/s/ Paul Clanon
Paul Clanon
Executive Director
MICHAEL R. PEEVEY
PRESIDENT
DIAN M. GRUENEICH
JOHN A. BOHN
RACHELLE B. CHONG
TIMOTHY ALAN SIMON
Commissioners
Energy Efficiency
2006- 2008 Verification ReportPrepared by Energy Division
October 15, 2009
Acknowledgments
We wish to acknowledge the effort put into completing this report by the CPUC Energy Division staff and all of the consultants and contractors who performed the detailed work and provided valuable insights.

Table of Contents
3. Policy and Procedural Background 1717
4. The Minimum Performance Standard and Performance Earnings Basis 2222
5. Overview of Data Used to Calculate MPS and PEB 2929
5.1.1. Program Tracking Data 2929
5.1.3. Database for Energy Efficiency Resources 3131
5.1.4. Utility Workpapers 3232
5.1.5. Hardcopy Project Files 3232
5.1.6. Installation Rates from EM&V Contractor Verification Reports 3333
5.2.1. Methodology for compiling evaluated 2004-2005 savings 3333
5.2.2. 2004-2005 Savings Results 3636
5.2.3. Impact tables which include savings realized after 2005 3737
6. Methodology for Calculating 2006-2008 Savings and Benefits 4343
6.1. Verification Reporting Template (VRT) 4444
6.2. Populating the VRT with All Measures to Be Updated 4848
6.3. Updating Measures in the VRT with Installation Rates and DEER Parameters 5151
6.3.1. Methodology for Updating Installation Rates in the VRT 5151
6.3.2. Methodology for Updating EUL and NTG Values in the VRT 5454
6.3.3. Methodology for Updating UES Values in the VRT 5757
6.3.3.1. DEER Measure/Run IDs 6060
6.3.3.5. Interim Database Results - Assigning DEER UES Values 6262
6.4. Running the VRT to Calculate Adjusted Energy Savings and PEB Values 6363
6.4.1. Scenario 1 - Utility Installation Counts, UES, NTG, and EUL Values are Unadjusted 6464
6.4.2. Scenario 2 - Adjustments Made To Utility Installation Count, UES, NTG, and EUL Values 6666
7. Calculation of Shareholder Incentives 7474
8. Changes Made to the 1st Verification Report 8585
8.2. Log of Corrections Made to Modeling Tools and Inputs 8787
8.3. Other Changes Made in Response to IOU Comments 9191
8.4. ED Responses to Parties' Comments 9797
8.5. Additional Documentation for 2nd Verification Report 130130
9. Changes Made to 2nd Verification Report 131131
In Decisions 07-09-043 and 08-01-042,1 the California Public Utilities Commission (CPUC or Commission) adopted a Risk/Reward Incentive Mechanism (RRIM) to encourage the utilities to invest in energy efficiency. The mechanism provides an opportunity for the investor owned utilities2 to earn rewards on energy efficiency programs in amounts comparable to what the companies would otherwise earn through supply side investments. The Decisions establish a performance standard for the utilities, under which the utilities earn incentives if their energy efficiency program portfolios achieve certain quantitative energy efficiency savings goals.
Under the process adopted in Decisions 07-09-043 and 08-01-042, Energy Division is required to verify the costs and installations of the energy efficiency program activities, update the ex-ante parameters used to estimate program savings and benefits, and publish reports that calculate the earnings the utilities are eligible to claim. There are two interim earnings claims during the 2006-2008 three-year program cycle that are "progress payments" towards total expected earnings, and one final "true-up" payment after the program cycle is completed.
Energy Division submitted its draft verification report for the 2006-2007 program years in November 2008 for purposes of the first interim earnings claim. The Commission subsequently adopted Decision 08-12-059, which authorized interim incentive payments to utilities based on their quarterly savings reports and directed Energy Division to issue its second verification and final "true-up" reports via the resolution process. The Commission later opened Rulemaking 09-01-019, which rendered the 2006-2007 Verification Report moot for purposes of the first interim incentive payments and suspended the schedule for verification and review of the second interim incentive claims for 2006 through 2008, pending consideration of a new RRIM framework for that program cycle. Energy Division issued its Final 2006-2007 Verification Report on February 4, 2009, for informational or program planning purposes. 3
Energy Division is issuing this draft second Verification Report for the 2006-2008 program years pursuant to Decision 08-12-059 (Ordering Paragraphs 6 and 8).4 Depending on the Commission's consideration of a new RRIM framework, this 2nd Verification Report may serve as the basis for the second interim earnings claim for program activities through 2008, or may simply be used for other informational or program planning purposes.
For this 2nd Verification Report, Energy Division used the same methodologies as used to produce the results presented in the 1st Verification Report. As a result, much of the background and methodological discussion is unchanged from the 1st Verification Report, with only updated tables throughout the 2nd Verification Report to present new results.
Energy Division specifically made only the following changes to the 2nd Verification Report relative to the 1st Verification Report:
· Utility 2006-2008 records were used for this 2nd Verification Report.
In the 1st Verification Report, only the 2006-2007 records were used. The number of records in the tracking data set nearly doubled in the 2nd Verification Report relative to the 1st Verification Report.
· Installation rates from the 2006-2007 Contractor verification reports were applied to the 2006-2008 records.
Energy Division did not conduct additional field work to specifically develop new installation rates to apply to the 2008 tracking data.
· Low-Income Energy Efficiency (LIEE) program savings were updated to reflect reported savings from the 2008 LIEE program.
· Utility E3 calculators submitted for 2008 were used to map to the 2006-2008 records.
This resulted in the addition of 36 more E3 calculators than were used in the 1st Verification Report.
· The 2nd Verification Report updated 21 of the portfolio's largest programs.
The 1st Verification Report updated only 13 of the portfolio's largest programs.
Energy Division exercised its discretion as project managers to prioritize the EM&V work implemented during 2008 and elected to focus scarce EM&V resources (staff and evaluation contractors) on the more critical task of completing field work, surveys, and evaluation reports that will be used for the Final Performance Basis Report, to be completed in March 2010. This approach was considered to be a much more efficient use of ratepayer funds and EM&V resources compared to implementing another early round of on-site inspections and participant surveys on 2008 program participants solely to develop installation rates only for 2008. Many of the installation rates, however, will be updated in the final evaluation reports using 2008 EM&V results.
All the appendices, comments, and responses to comments, on the 1st Verification Report are included in this 2nd Verification Report for context and easy reference.
The RRIM earnings accrue if the utility meets or exceeds the Minimum Performance Standard (MPS), a threshold of 85% of the Commission's savings goals (80% for SoCalGas). If the utility achieves 100% of the goals, the earnings rate increases as a reward for superior performance. The 85% and 100% threshold earnings rates, set at 9% and 12% respectively, are used to calculate a share of the Performance Earnings Basis (PEB), which determines the amount of shareholder incentives that the utility will be eligible to collect from electric distribution or gas transportation rates. The PEB is an estimate of the benefits created by the utility portfolio minus the costs of the utility portfolio, measured in monetary terms.
The key threshold requirements for the 2006-2008 interim earnings claim from Decisions 07-09-043 and 08-01-042 are:
· If the metric average is equal to or greater than 65% and below 85% of goal (80% for SoCalGas), and each individual metric is equal to or greater than 65% of goal, then there are no earnings and no penalties.
· If the metric average is equal to or greater than 85% (80% for SoCalGas) and below 100% of goal, and each individual metric is equal to or greater than 80% of goal, then the IOU can claim 9% of PEB in earnings.
· If the metric average is equal to or greater than 100% of goal and each individual metric is equal to or greater than 95% of goal, then the IOU can claim 12% of PEB in earnings.
· If any individual metric falls to or below 65% of goal, then penalties will be applied.
Tables ES1a to ES1c below sets forth the incentive amounts for which each utility is eligible in this second interim period. Tables ES2a to ES2c provide the GWh, MW and therm savings calculated for each utility. These energy savings impacts were calculated with and without interactive effects.5 Table ES2a includes only positive interactive effects in calculating savings; Table ES2b includes both positive and negative interactive effects in the calculation of savings; Table ES2c does not include any interactive effects.
The total accomplished GWh, MW, and Therm savings included in the MPS calculation are the sum of the following quantities:
· The 2006-2008 EE portfolio verified GWh, MW, and Therm savings accomplishments.
· 50% of the 2006 and 2007 verified savings attributed to pre-2006 Codes and Standards advocacy work.
· The 2004 and 2005 EE portfolio evaluation adjusted GWh, MW, and Therm savings accomplishments.
· The 2004 through 2008 LIEE program evaluation adjusted GWh, MW and MTherms savings accomplishments.
The PEB is a representation of net program benefits that is calculated by combining two-thirds of the Total Resource Cost (TRC) net benefits and one-third of the Program Administrator Cost (PAC) net benefits. The TRC and PAC are cost-benefit analysis methodologies commonly used for evaluating utility sector Demand-Side Management programs. The TRC and PAC costs include program administrative costs. The TRC additionally includes the costs incurred by program participants. The TRC and PAC benefits include estimates of supply-side costs avoided by the implementation of energy efficiency programs.
The TRC and PAC net benefits are calculated as described in the Standard Practice Manual,6 and as clarified in D.06-06-0637 issued in Rulemaking 04-04-025, the 12/21/2006 ALJ Ruling8 issued in R.06-04-010, and modified for a "free-rider-adjustment" in D.07-09-043 issued in R.06-04-010. The TRC and PAC tests, and their application to the PEB calculation, are described in the Energy Efficiency Policy Manual, Version 4.0.9 In summary, the TRC and PAC tests convert electric and gas energy and electric demand savings to monetized avoided cost benefits, and produce (using program administrative costs and program participant costs) benefit/cost ratios and monetized net benefit values. The TRC and PAC tests are calculated in a customized Excel spreadsheet known as the "E3 Calculator."
The components included in the PEB and MPS calculations are described in Section 4 of the Report. The data used to calculate the MPS and PEB for the 2006-2008 Interim Verification Report are discussed in Section 5.
The methodology for calculating 2006-2008 savings and benefits is set out in Section 6 of the Report. The CPUC Energy Division (ED) developed the "Verification Report Template," which is a Microsoft (MS) Access application used to compile IOU savings and cost claims and program tracking data. The VRT supports automated E3 Calculator runs and can summarize savings and net benefits across all runs, by IOU, and place these results in the RRIM calculator developed by ED, included as part of Appendix R. Generation of adjusted energy savings and PEB values using the VRT is discussed in Section 6 of the Report. The VRT User's Manual is provided in Appendix F10 and the full VRT and associated files are provided in Appendix R. The VRT was developed to allow Energy Division to calculate the MPS and PEB in an efficient, transparent, and repeatable manner.
Energy Division developed a spreadsheet tool, the RRIM Calculator, to calculate the earnings or penalties for each utility, once the GWh, MW, and MMTh accomplishments have been assembled and TRC & PAC net benefits have been calculated with the E3 Calculator engine. The RRIM Calculator is designed to calculate and track the 2006-2007 and 2008 interim incentives as well as the final three year cycle true-up. Section 7 of the Report provides a walk-through for the RRIM Calculator.
The following tables show the incentive earnings that the utilities are eligible to claim as second interim payment, based on the results in this 2nd Verification Report (i.e., utilities' achievement of the MPS and the estimated PEB), applying the 35% holdback from the total allowable earnings, and subtracting the first interim payments that the Commission approved in Decision 08-12-059. (The 35% holdback amount will be subject to the final true-up based on Energy Division's Final Verification and Performance Basis Report in March 2010, as per Decision 08-01-042.)
Table ES1a. Allowable Earnings
Table ES1b. Allowable Earnings
Table ES1c. Allowable Earnings
Table ES2a: GWh, MW, MMTherm Impacts with Positive Interactive Effects Only | |||||
|
2nd Earnings Claim (PY2006-2008) | ||||
|
PG&E |
SCE |
SDGE |
SoCalGas |
Total |
|
|
|
|
|
|
Savings Goals |
PY 2004-2008 | ||||
Total Cumulative Savings (GWH) |
4,313 |
4,788 |
1,387 |
0 |
10,488 |
Total Peak Savings (MW) |
936 |
1,006 |
264 |
0 |
2,206 |
Total Cumulative Natural Gas Savings (MMTh) |
64 |
0 |
13 |
77 |
154 |
|
|
|
|
|
|
Total Savings |
PY 2004-2008 | ||||
Total Cumulative Savings (GWH) |
4,184 |
4,278 |
979 |
0 |
9,442 |
Total Peak Savings (MW) |
811 |
854 |
200 |
0 |
1,865 |
Total Cumulative Natural Gas Savings (MMTh) |
77 |
0 |
12 |
70 |
159 |
MPS Individual Metric Performance |
|
|
|
|
|
Percent of Goal (GWH) |
97% |
89% |
71% |
0% |
90% |
Percent of Goal (MW) |
87% |
85% |
76% |
0% |
85% |
Percent of Goal (MMTh) |
120% |
0% |
88% |
91% |
103% |
|
|
|
|
|
|
MPS Average Metric Performance |
101% |
87% |
78% |
91% |
93% |
Table ES2b: GWh, MW, MMTherm Impacts with Positive and Negative Interactive Effects | |||||
|
2nd Earnings Claim (PY2006-2007) | ||||
|
PG&E |
SCE |
SDGE |
SoCalGas |
Total |
|
|
|
|
|
|
Savings Goals |
PY 2004-2008 | ||||
Total Cumulative Savings (GWH) |
4,313 |
4,788 |
1,387 |
0 |
10,488 |
Total Peak Savings (MW) |
936 |
1,006 |
264 |
0 |
2,206 |
Total Cumulative Natural Gas Savings (MMTh) |
64 |
0 |
13 |
77 |
154 |
|
|
|
|
|
|
Total Savings |
PY 2004-2008 | ||||
Total Cumulative Savings (GWH) |
4,184 |
4,278 |
979 |
0 |
9,442 |
Total Peak Savings (MW) |
811 |
854 |
200 |
0 |
1,865 |
Total Cumulative Natural Gas Savings (MMTh) |
53 |
0 |
8 |
70 |
132 |
MPS Individual Metric Performance |
|
|
|
|
|
Percent of Goal (GWH) |
97% |
89% |
71% |
0% |
90% |
Percent of Goal (MW) |
87% |
85% |
76% |
0% |
85% |
Percent of Goal (MMTh) |
83% |
0% |
65% |
91% |
85% |
|
|
|
|
|
|
MPS Average Metric Performance |
89% |
87% |
70% |
91% |
87% |
Table ES2c: GWh, MW, MMTherm Impacts without Interactive Effects |
|||||
|
2nd Earnings Claim (PY2006-2007) | ||||
|
PG&E |
SCE |
SDGE |
SoCalGas |
Total |
|
|
|
|
|
|
Savings Goals |
PY 2004-2008 | ||||
Total Cumulative Savings (GWH) |
4,313 |
4,788 |
1,387 |
0 |
10,488 |
Total Peak Savings (MW) |
936 |
1,006 |
264 |
0 |
2,206 |
Total Cumulative Natural Gas Savings (MMTh) |
64 |
0 |
13 |
77 |
154 |
|
|
|
|
|
|
Total Savings |
PY 2004-2008 | ||||
Total Cumulative Savings (GWH) |
4,085 |
4,171 |
954 |
0 |
9,211 |
Total Peak Savings (MW) |
738 |
782 |
186 |
0 |
1,706 |
Total Cumulative Natural Gas Savings (MMTh) |
77 |
0 |
12 |
70 |
159 |
MPS Individual Metric Performance |
|
|
|
|
|
Percent of Goal (GWH) |
95% |
87% |
69% |
0% |
88% |
Percent of Goal (MW) |
79% |
78% |
71% |
0% |
77% |
Percent of Goal (MMTh) |
120% |
0% |
88% |
91% |
103% |
|
|
|
|
|
|
MPS Average Metric Performance |
98% |
82% |
76% |
91% |
89% |
In Decisions 07-09-043 and 08-01-042,11 the California Public Utilities Commission (CPUC or Commission) adopted a Risk/Reward Incentive Mechanism (RRIM) to encourage the utilities to invest in energy efficiency. The mechanism enables the investor owned utilities12 to earn rewards on energy efficiency programs in amounts which will approach supply-side earnings at a level of superior performance that is significantly greater than the forecasted level of savings or net benefits expected from the authorized energy efficiency portfolio. The Decisions establish a performance standard for the utilities, under which the utilities earn incentives if their energy efficiency program portfolios achieve certain quantitative energy efficiency savings goals.
Decision 07-09-043 establishes the earnings claim and recovery process. There are two interim earnings claims during the 2006-2008 three-year program cycle that are "progress payments" towards total expected earnings, and one final "true-up" payment after the program cycle is completed. Under the process adopted in Decisions 07-09-043 and 08-01-042, Energy Division is required to verify the costs and installations of the energy efficiency program activities, update the ex-ante parameters used to estimate program savings and benefits, and publish a report which calculates earnings the utilities are eligible to claim. This Verification Report covers program years 2006-2008, and may serve as the basis for the second interim incentives claim for the 2006-2008 program period, depending on the Commission's consideration of a new RRIM framework as discussed below, or may simply be used for other informational or program planning purposes.
3. POLICY AND PROCEDURAL BACKGROUND
This section provides an overview of the Risk/Reward Incentive Mechanism adopted by the Commission. It is intended to give the reader familiarity with the procedural background leading up to this verification report. Greater detail can be found in Decisions 07-09-043, 08-01-042, and 08-12-059.
.
3.1.1. Summary of RRIM phase of EE proceeding
In Decision 04-09-060,13 the Commission adopted numerical electricity and natural gas energy efficiency savings goals to be achieved by the utilities through the year 2013. These goals were adopted as part of the Commission's effort to achieve the objectives of the 2003 Energy Action Plan (EAP).14 By the time the EAP was updated in October 2005,15 the utilities had been formally established as the energy efficiency program administrators, and the California energy policy agencies had identified the adoption of a verifiable performance-based incentive mechanism that balances utility shareholder and ratepayer risk as a key action for obtaining all cost-effective energy efficiency. In September 2007, the Commission adopted a risk/reward incentive mechanism (RRIM) based on avoided cost net benefits.
A central element of the RRIM is annual verification of program accomplishments, which is accompanied by measurement of actual energy savings and demand reduction that is to be completed by the Commission's Energy Division at the end of the program cycle. Decision 08-01-042 eliminated the requirement for the utilities to pay back interim earnings if, in the final evaluation, their accomplishments fall between 65% and 85% of the Commission adopted savings goals. D. 08-01-042 also required Energy Division to use parameter estimates from the 2008 update of the Database for Energy Efficient Resources (DEER)16 when reporting accomplishments and calculating the utilities' performance for this report. The ordering paragraph establishing this requirement is provided below in its entirety.
Ordering Paragraph 3 of D.08-01-042
3. For the 2006-2008 program cycle, the following ex ante assumptions of energy savings and demand reductions shall be used in conjunction with verified installations and verified costs to calculate the 1st and 2nd Claims:
a) Except as otherwise provided for below, the ex ante measure savings parameters that are contained in the utilities' E3 calculators, as of the 4th quarter 2007 report for the 1st Claim and as of the 4th quarter 2008 report for the 2nd Claim.
b) For measures contained in the Database for Energy Efficient Resources (DEER), the 2008 and 2009 DEER updates of ex ante measure savings parameters, including net-to-gross ratios and expected useful lives. The 2008 DEER update shall apply to the 1st Claim and the 2009 DEER update shall apply to the 2nd Claim.
c) For customized measures or customized projects that represent aggregated measures in the E3 calculator, Energy Division shall identify the appropriate installed measure(s) based on its measure verification results and develop the associated ex ante load impact values. For this purpose, Energy Division may use the utilities' tracking system information, engineering workpapers, DEER values and methods, or other current measurement and verification results that are available.
Energy Division submitted its draft verification report for the 2006-2007 program years in November 2008 for purposes of the first interim earnings claim. The Commission subsequently adopted Decision 08-12-059, which authorized interim incentive payment of $81.2 million to the utilities based on their quarterly savings reports and directed Energy Division to issue its second verification and final "true-up" reports via the resolution process. The Commission later opened Rulemaking 09-01-019, which rendered the 2006-2007 Verification Report moot for purposes of the first interim incentive payments and suspended the schedule for verification and review of the second interim incentive claims for 2006 through 2008, pending consideration of a new RRIM framework for that program cycle. Energy Division, nevertheless, issued its Final 2006-2007 Verification Report on February 4, 2009, for informational or program planning purposes.
The Commission is also revisiting the RRIM for the 2009-2011 program cycle and beyond in the new Rulemaking (R.09‐01‐019). The Commission identified the need to reconsider the RRIM earlier than anticipated in Decision 07‐09‐043 and will be considering proposed changes to the RRIM that Energy Division, the IOUs, and other parties have proposed to date in future decisions later this year or in 2010.
3.1.2. 2006-2008 Evaluation Management
In Decision 05-01-055, the Commission made the CPUC Energy Division responsible for managing and contracting for all evaluation, measurement and verification (EM&V) studies used to:
· Measure and verify energy and peak load savings for individual programs, groups of programs and at the portfolio level;
· Generate the data for savings estimates and cost-effectiveness inputs;
· Measure and evaluate achievements of energy efficiency programs, groups of programs and/or the portfolio in terms of the "performance basis" established under the CPUC-adopted EM&V protocols17 ; and
· Evaluate whether program goals are met.
In August 2007, the CPUC awarded contracts for the performance of EM&V work in 13 energy efficiency program areas. Table 1 provides a list of the EM&V projects currently managed by ED. ED staff is involved in all aspects of contract and evaluation management, providing direction and oversight of the evaluation process. The resulting evaluation reports will be used to improve the future energy efficiency programs and policy, and inform the incentives mechanism set forth in Decision 07-09-43.
Table 1: Energy Division's Program EM&V Projects
Contract |
Contractor |
Marketing Outreach and Information |
Opinion Dynamics Corporation |
Emerging Technologies |
Summit Blue Consulting, LLC. |
Codes & Standards and New Construction |
Kema (formerly RLW Analytics, Inc.) |
Residential Retrofit |
The Cadmus Group, Inc. |
Small Commercial |
Itron |
Major Commercial |
SBW Consulting, Inc |
Commercial Facilities |
ADM Associates |
Specialized Commercial |
Kema (formerly RLW Analytics, Inc.) |
Commercial Retro-Commissioning |
SBW Consulting, Inc |
PG&E Agricultural |
KEMA |
PG&E Industrial |
Itron |
Southern California Industrial And Agricultural |
Itron |
Local Government Partnerships |
Summit Blue Consulting, LLC. |
3.1.2.1. Verification Activities
Energy Division obtained measure savings data for each program from the IOU Quarterly Reports submitted to the Energy Efficiency Groupware Application (EEGA)18 for the period 1/1/2006 through 12/31/2008. Individual measures were then categorized into measure groups for each utility. A review of this measure mapping exercise indicated that a relatively small number of measure and program combinations accounted for approximately 80% of total utility-reported annual energy and demand savings. These program/measure group combinations were referred to as high-impact combinations. This clustering of reported utility annual energy and demand savings around a relatively small number of high impact combinations suggested that a coordinated approach across selected evaluation Contract Groups19 would yield robust results at the utility portfolio level in the most cost effective manner. Furthermore, due to the complexity of the data and the size of the portfolios, it was impractical for Energy Division to evaluate, update, and review for clerical error every measure for which the utilities made savings claims. Therefore, a large number of the utility programs and a modest proportion of the claimed savings have not been evaluated, and utility estimates were used in the calculations in those cases.
The Contract Groups represented by the high impact combinations include:
· The Residential Retrofit Contract Group
· The Small Commercial Contract Group
· The Major Commercial Contract Group
· The PG&E Industrial Programs Contract Group
A fifth Contract Group, the Local Government Partnerships Contract Group, was added in anticipation of a large number of CFL giveaways coordinated by Local Government Partnership programs. Because these five Contract Groups accounted for such a large fraction of the GWh, MW, and therm savings for the IOUs, the Energy Division assigned verification tasks to only these five Contract Groups.
The list of measure groups analyzed in this Verification Report is shown in Table 2. The verification reports submitted to ED by the EM&V contractors are provided in Appendix A.
Table 2: Measure Groups Defined for the First Verification Study
Residential Measure Groups |
Commercial Measure Groups |
Appliances |
Appliances |
Appliances Recycling |
Cooling |
Cooling |
Duct seal and AC tune-up |
Duct seal and AC tune-up |
Exterior lighting |
Exterior lighting |
Food Service |
Glazing and skylights |
Glazing and skylights |
Heating |
Heating |
Interior lighting |
HVAC Controls |
Interior screw lighting |
Interior lighting |
Opaque Shell |
Interior screw lighting |
Other |
Lighting controls |
Water heating |
Motors |
Whole building and custom |
Motor controls |
Water heating controls |
Opaque Shell |
Other | |
Process | |
Refrigeration | |
Retro-commissioning | |
Water heating | |
Whole building and custom |
4. THE MINIMUM PERFORMANCE STANDARD AND PERFORMANCE EARNINGS BASIS
The RRIM earnings accrue if the utility meets or exceeds the Minimum Performance Standard (MPS), a threshold of 85% of the Commission's savings goals (80% for SoCalGas). If the utility achieves 100% of the goals, the earnings rate increases as a reward for superior performance. The 85% and 100% threshold earnings rates, set at 9% and 12% respectively, are used to calculate a share of the Performance Earnings Basis (PEB), which determines the amount of shareholder incentives that the utilities will be eligible to collect in electric distribution or gas transportation rates. The PEB is an estimate of the benefits created by the utility portfolio minus the costs of the utility portfolio, measured in monetary terms.
In order to determine if the utility has met any of the MPS thresholds, each individual utility's total accomplished cumulative net annual GWh, MW, and Therms savings are calculated as a percentage of the utility-specific 2008 cumulative goals adopted in D.04-09-060. In addition to an average goal attainment for all the metrics (GWh, MW, and Therms), each individual metric alone has a threshold requirement.
The key threshold requirements for the 2006-2008 interim earnings claim from Decisions 07-09-043, 08-01-042, and 08-12-059 are:
· If the metric average is equal to or greater than 65% and below 85% of goal (80% for SoCalGas), and each individual metric is equal to or greater than 65% of goal, then there are no earnings and no penalties.
· If the metric average is equal to or greater than 85% (80% for SoCalGas) and below 100% of goal, and each individual metric is equal to or greater than 80% of goal, then the IOU can claim 9% of PEB in earnings.
· If the metric average is equal to or greater than 100% of goal and each individual metric is equal to or greater than 95% of goal, then the IOU can claim 12% of PEB in earnings.
· If any individual metric falls to or below 65% of goal, then penalties will be applied.
· If a utility continues to exceed the 65% of savings goals threshold for each individual metric on an ex post basis, it will not be required to pay back any interim incentives payments earned. However, if ex post results indicate a utility has dropped below 65% of savings goals for any individual metric, the utility must pay back any interim payments earned, and penalties will be assessed
4.1.1. Components Included in the MPS Calculation
The total accomplished GWh, MW, and Therm savings included in the MPS calculation are the sum of the following quantities:
1. The 2006 - 2008 EE portfolio verified GWh, MW, and Therm savings accomplishments.
· Except as noted below, the measure level parameters are as reported in the utilities' 4th Quarter 2008 Report E3 spreadsheets.
· Measure level parameters from the utilities' program tracking systems are used where the E3 spreadsheet line items represent aggregated measures that do not match the program tracking database line items.
· Installation rates for which samples of installations have been inspected by ED contractors to verify proper installation have been applied to most high-impact measure/program combinations.
· Measure level parameters from the DEER 2008 update have been applied to many high-impact measure/program combinations.
· Realization rates have been applied to a subset of measures which utilize a "customized" approach to provide impact estimates.
2. 50% of the 2006 and 2007 verified savings attributed to pre-2006 Codes and Standards advocacy work.
· This quantity consists of savings originally estimated by the IOUs as attributable to the codes and standards advocacy program, adjusted by the change in construction rates, the time lag in construction completion, and the effective date of appliance standards.
· Since there was no verification report for 2008 savings that can be attributed to pre-2006 Codes and Standards advocacy work, no additional savings were applied in this analysis.
3. The 2004 and 2005 EE portfolio evaluation adjusted GWh, MW, and Therm savings accomplishments.
· If an evaluation was completed, ED used the realized savings from the evaluation report.
· If the evaluation of the program was completed, but realized savings for every program element were not explicitly provided in the evaluation report, or large gaps in ex-ante savings were evident, ED applied the net realization rate in the evaluation report to the filed net savings submitted in the final annual report for that program if disaggregated data was made available by the utilities, otherwise the workbooks available on EEGA were utilized.
· If the evaluation of the program was complete, but a final evaluation report was not yet published, ED used the draft realized savings from the evaluation.
· If the evaluation was not complete, ED used the filed savings in the annual report, if available in disaggregated form, otherwise final program workbook posted on EEGA were used.
4. The 2004 through 2008 LIEE program evaluation adjusted GWh, MW, and Therm savings accomplishments.
· PY 2005 savings come from the 2005 LIEE evaluation report.
· The savings data for 2004, 2006, 2007, and 2008 comes from IOU LIEE reports filed with the CPUC.
The MPS process is illustrated in Figure 1.
Figure 1: MPS Process Flowchart
The PEB is a representation of net program benefits. The PEB is calculated by combining two-thirds of the Total Resource Cost (TRC) net benefits and one-third of the Program Administrator Cost (PAC) net benefits. The TRC and PAC are cost-benefit analysis methodologies commonly used for evaluating utility sector Demand-Side Management programs. The TRC and PAC costs include program administrative costs. The TRC additionally includes the costs incurred by program participants. The TRC and PAC benefits include estimates of supply-side costs avoided by the implementation of energy efficiency programs.
4.2.1. Components Included in PEB Calculation
All program costs and benefits are included the PEB calculation, with a few exceptions. Commission policy excludes certain costs and benefits that are either used only for measuring the MPS thresholds, are not measured through the evaluation process, or are excluded in order to encourage desired program activities which do not produce avoided cost benefits that can be directly measured and attributed. The following exceptions apply to the PEB costs and benefits:
1. The costs for the Emerging Technologies programs are not counted in the calculation of TRC and PAC costs.
2. The savings and costs attributed to pre-2006 Codes and Standards advocacy work are not counted in the calculation of TRC and PAC benefits.
3. The savings and costs for Low Income Energy Efficiency (LIEE) programs are not counted in the calculation of TRC and PAC costs or benefits.
4. The EE shareholder incentive earnings are not counted in the calculation of TRC and PAC costs.
5. Participant spillover, market effects, and most indirect impacts are not counted in the calculation of TRC and PAC benefits.
6. All other costs and avoided cost benefits are included the calculation of TRC and PAC net benefits.
The TRC and PAC net benefits are calculated as described in the Standard Practice Manual,20 and as clarified in D.06-06-06321 issued in R. 04-04-025, the 12/21/2006 ALJ Ruling22 issued in R.06-04-010, and modified for a "free-rider-adjustment" in D.07-09-043 issued in R.06-04-010. The TRC and PAC tests, and their application to the PEB calculation, are described in the Energy Efficiency Policy Manual, Version 4.0.23 In summary, the TRC and PAC tests convert electric and gas energy and electric demand savings to monetized avoided cost benefits, and produce (using program administrative costs and program participant costs) benefit/cost ratios and monetized net benefit values.
The TRC and PAC methodologies specify how EE portfolio costs and benefits are calculated. All costs and benefits are specified to be calculated as the sum of the cost and benefit for each measure installed within an EE cycle as a result of the utilities' energy efficiency portfolio activities. The primary costs and benefits included in the TRC test are as outlined in Figure 2. The PAC benefits are equal to the TRC benefits but the PAC costs do not include any participating customer costs.
The TRC and PAC tests are calculated in a customized Excel spreadsheet known as the "E3 Calculator." The E3 Calculator performs the TRC and PAC cost/benefit calculations using the following data.
1. Avoided Costs - The latest Commission adopted values; most recently updated by D.06-06-063.
2. Portfolio Administration Costs - The total costs incurred to implement the utility programs, including measure costs such as rebates and other incentives (mid/upstream incentives and direct install costs).
3. Measure Data - All the measure specific parameters used in the TRC calculation outlined in the 1/2/2007 ALJ Ruling24 issued in R.06-04-010.
Figure 2: TRC Benefits and Costs
5. OVERVIEW OF DATA USED TO CALCULATE MPS AND PEB
The Energy Division relied on six primary sources of data to calculate the 2006-2008 program savings and benefits:
1. Program Tracking Data
2. E3 Calculators
3. Database for Energy Efficiency Resources
4. Utility Work Papers
5. Hardcopy Project Files
6. Installation Rates from EM&V Contractor Verification Reports
5.1.1. Program Tracking Data
The term "program tracking data" is generically used to refer to the elementary underlying information on program measures installed and rebated through the utility energy efficiency programs. Each utility has different systems and procedures for managing program related data. The program tracking databases contain detailed information on program participants and specific energy efficiency projects. Since the evaluators required facility-level customer specific information in order to design sampling plans for completing physical inspections of installations, the tracking data was used as the sample frame for most of the field verification activities.
5.1.2. E3 Spreadsheets
The utilities use the E3 calculator to calculate energy savings, demand reduction, and cost-benefit estimates on both a prospective (forecasting) basis and a retrospective (reporting) basis. The savings and cost-benefit calculations are based on measure level data, which is entered into the "input" sheet of the E3 calculator. The measure level data is used to calculate avoided cost benefits using the Commission-approved hourly avoided cost methodology.
In most cases, the line items in the E3 input sheet represent aggregations of cases from the program tracking databases, as can be seen in Table 3.25 All measures listed in the E3 calculators should be reconcilable to the program tracking databases. In total, there are 248 E3 calculators, 177 of which actually report energy savings measures, resulting in 20,721 rows of measures.
Table 3: Comparison of E3 Spreadsheet and Program Tracking Database Data
Utility |
E3 Rows |
Tracking DB Rows |
Program Tracking Data Source Table |
PGE |
6,210 |
2,958,366 |
PGE_FROZEN_030209_2006Q.mdb, PGE_FROZEN_030209_2007Q.mdb, PGE_FROZEN_030209_2008Q.mdb |
SCE |
13,658 |
TBD |
tblProgramTrackingData |
SDGE |
659 |
294406 |
Installed Projects - SDG&E - 2006-2008_Revised_03-24-09.mdb |
SCG |
194 |
194136 |
Installed Projects - SCG - 2006-2008_Q4-Revised_03_24_09.mdb |
Total |
20,721 |
3,446,908 excluding SCE |
|
The utilities are required to submit the E3 calculator inputs, calculation results, and calculation engines each quarter as part of their quarterly reports to ED. To avoid confusion, the E3 calculator inputs and results are referred to as the "E3 spreadsheet" throughout this report. The Excel tool that performs the savings and net benefits calculations is referred to as "E3 calculator" or "E3 calculator engine" throughout this report. For the 2006-2008 period, the Commission ruled in D.08-01-042 that the measure savings parameters in the utilities' E3 calculators submitted with the 4th quarter 2008 report are the ex-ante values to be used in conjunction with verified installations and verified costs to calculate the utilities' earnings claim.26&27
Table 4 lists the sources of the E3 calculator input/output files used for the 2006-2008 period.
Table 4: Source E3 Spreadsheets
ID |
Utility |
Report Name |
Version |
Report Period |
Uploaded |
2272 |
SDGE |
SDGE_E3_Q4_2008.zip |
1 |
Q4 2008 |
3/31/2009 |
2138 |
PGE |
4Q08 E3 Calculators revised.zip |
1 |
Q4 2008 |
3/9/2009 |
2434 |
SCE |
SCE 4th Quarter 2008 E3 Calculator Exports.zip |
1 |
Q4 2008 |
4/21/2009 |
2277 |
SCG |
scg_e3_Input_output_files.zip |
1 |
Q4 2008 |
3/31/2009 |
For the purposes of calculating the PEB, ED has updated parameters at either the tracking level of data or the E3 level of data.
It should be noted that the calculations of the TRC and PAC are derived from the utility specific E3 calculator engines identified in Table 5.
Table 5: Source E3 Calculator engines
Utility |
File Name |
Source |
PGE |
PG&E Tool 4c.zip |
http://www.ethree.com/downloads/E3%20Calculators/PG&E%20Tool%204c.zip |
SCE |
SCE Tool 4b (1000).zip |
http://www.ethree.com/downloads/E3%20Calculators/SCE%20Tool%204b%20(1000).zip |
SDGE |
SDG&E Tool 4b (800).zip |
http://www.ethree.com/downloads/E3%20Calculators/SDG&E%20Tool%204b%20(800).zip |
SCG |
SoCal Tool 4b (800).zip |
http://www.ethree.com/downloads/E3%20Calculators/SoCal%20Tool%204b%20(800).zip |
5.1.3. Database for Energy Efficiency Resources
As part of the ex-ante update required by Decision 08-01-042, Energy Division is using the latest MPS and PEB parameter values from the 2008 DEER Update for measures included in the DEER database. DEER is a database of Net-to-Gross (NTG), Effective Useful Life (EUL), and Unit Energy Savings (UES) values for standard or "deemed" energy efficiency measures. Deemed measures are energy efficiency projects and technologies that are relatively simple to analyze and evaluate, and do not vary tremendously with individual projects. Measures whose performance varies significantly due to the specifics of the individual projects are categorized as "custom" measures and are not currently covered by DEER UES values. However, DEER NTG and EUL values are used for custom measures.
NTG values are drawn from the most recent and/or applicable program evaluation studies. EUL values are based on a variety of sources including recent evaluation studies, utility workpapers, and various industry-specific data. UES values in DEER are generated using industry-standard building simulation software and engineering algorithms. Engineering algorithms are based on industry-standard engineering assumptions, originating from the American Society of Heating, Refrigerating and Air-Conditioning Engineers (ASHRAE)28 or other professional societies.
All of the studies, algorithms, assumptions, and building simulation tools are open source and available for review. The data sources, analytical approach documentation, user documentation, and user tools can be downloaded from the DEER web site.29 The methods for applying the DEER update results to measures listed in the program tracking systems and E3 calculators are described in Section 6.2 of this report.
5.1.4. Utility Workpapers
The ex-ante savings assumptions for project-dependent custom measures are documented in utility workpapers.30 Ordering Paragraph 4 of the 12/21/2006 ALJ Ruling requires the utilities to submit workpaper documentation on a quarterly basis that shows how the savings values are calculated for custom measures.
In most cases, the utility workpaper values have been used in ED's MPS and PEB calculations. Exceptions to this rule are described in Section 6.5.
5.1.5. Hardcopy Project Files
In addition to the program tracking databases, the utilities maintain hardcopy paper records of the more complex energy efficiency projects and contracts. For sampled projects, it was essential to review the hardcopy project files in order to fully understand the project details, plan on-site inspections, and conduct analyses of data collected in the field.
5.1.6. Installation Rates from EM&V Contractor Verification Reports
ED authorized the EM&V Contract Groups in Table 6 to conduct verification studies of measure installations during the 2006-08 period:
Table 6: Contract Groups Responsible for Performing Verification Studies
Contract Group |
Residential Retrofit |
Small Commercial |
Major Commercial |
Local Government Partnerships |
PG&E Industrial |
The EM&V contractors conducted on-site inspections and surveys on sampled participants and non-participants to verify whether the measures recorded in the program tracking systems were actually installed and operational in the field. The outputs of this on-site and survey work are installation rates, which represent the ratio of measure counts observed in the field over measure counts reported in the program tracking databases. Installation rates are used to adjust the installation counts for populations of measures from which samples were drawn. Installation rates constitute one of the key adjustments made by ED in calculating the MPS and PEB.
The methods for obtaining installation rates through on-site inspections and surveys are discussed in detail in the verification reports submitted to ED by the EM&V contractors, provided in Appendix A. The methods for applying the installation rates to adjust the installation counts for populations of measures from which samples were drawn are discussed in section 6.3 of this report.
Resource acquisition programs implemented in the 2004-2005 cycle were subject to impact evaluations. Evaluation contractors were hired by the utilities starting in 2004 and final evaluation plans were approved by Energy Division staff. Program evaluations were conducted and the draft evaluation results were reviewed by the utilities, Energy Division staff, and Energy Division consultants. After considering input from all parties and making necessary revisions and edits, final evaluation reports were approved by Energy Division staff and posted on the California Measurement Advisory Council website (www.calmac.org), managed by the IOUs for the purpose of warehousing evaluation reports.
Each program evaluation was required to report realized annual electric and gas savings and demand reduction for 2004 and 2005 in an "Impact Reporting Table." The Impact Reporting Table follows a standardized format and is included in each final evaluation report, with a few exceptions. Savings reported in these impact tables were the primary source of information on evaluated accomplishments for the 2004-2005 programs.
To compile the evaluated savings for 2004-2005, the following rules were employed:
A. If an evaluation was completed, the realized savings from the evaluation report was used.
B. If the evaluation of the program was completed, but realized savings for each program funding component (PGC or Procurement) were not explicitly provided in the evaluation report, or large gaps in ex-ante savings were evident, ED applied the net realization rate in the evaluation report to the filed net savings recorded in the annual reports, where disaggregated data was made available.31
C. If the evaluation of the program was complete, but a final evaluation report was not yet published, Energy Division used the draft realized savings from the evaluation.
D. If the evaluation was not complete, ED used the filed savings in the annual report, if available in disaggregated form; otherwise, final program workbook posted on EEGA was used.
A - Programs with completed evaluations
Appendix B provides a list of programs and links to all evaluation reports and workbooks that were used in this estimate of evaluated savings.
B - Programs with completed evaluations that did not report realized savings
Annual savings for the programs in Table 7 were not specifically cited in the final evaluation reports, or significant gaps were identified during the review of the ex-ante savings reported in the evaluation and the utility filed savings. To allow evaluation-adjusted credit for these programs, the filed savings (included in the annual report) were adjusted by the net realization rates reported in the evaluations. The spreadsheet in Appendix C contains the entire calculations ED used to apply the realization rates in Table 7. Evaluation adjusted savings for SCE's Summer Initiative programs, which were missing from the draft verification report, were also added using the same approach.
Table 7: Programs for which Realized Savings were not Explicitly Provided in the Evaluation
Program ID |
Utility |
Funding |
Program Name |
Realization Rate Applied to Filed Savings |
Source |
1176-04 |
SCE-PROC |
Proc |
SW-MF Rebate |
0.32 GWh 0.31 MW 0.15 Therms |
Evaluation of the 2004-2005 Statewide Multifamily Rebate Program Evaluation - Vol 1. KEMA, March 16, 2007. Table 1-4 "Measured Savings" % of reported accomplishments, Net MW, GWh, Therms pg. 1-9 |
1509-04 |
SDG&E-PROC |
Proc | |||
1261-04 |
SCE |
PGC |
Savings By Design |
0.82 GWh32 0.67 MW |
An Evaluation of the 2004-2005 Savings By Design Program; RLW Analytics, October 2008 Revision; Table 9 (PG&E Impact table) Table 10 (SCE Impact table) Table 12 (SCG Impact table) |
1506-04 and 1127-04 |
PG&E |
Proc & PGC |
0.68 GWh 0.59 MW 0.50 therms | ||
1249-04 |
SCG |
PGC |
0.05 therms | ||
1325-04 |
SCE |
PGC |
Bakersfield Kern Partnership - SCE and SCG |
Residential 0.79 GWh 0.69 MW Commercial 0.46 GWh 0.78 MW |
PG&E 2004-05 Local Government Partnership Programs December 12, 2006; EcoNorthwest Bakersfield Kern Results - Table 30 and 32 (Residential); Table 50 and 52 (Commercial.) |
1230-04 |
SCG |
PGC | |||
1520-04 |
SDG&E-PROC |
Proc |
Small Business Energy Efficiency |
0.83 MW 0.49 GWh |
Evaluation of the SDG&E 2004-05 Small Business Energy Efficiency Program April 20, 2006; EcoNorthwest; Table ES-7 |
1377-04 |
SDG&E |
Proc |
Single-Family EE Rebates - SDGEProc |
Lighting 0.47 GWh 0.23 MW Non-Lighting 0.52 GWh 0.51 MW 0.37 therms |
2004/2005 Statewide Residential Retrofit Single-Family Energy Efficiency Rebate Evaluation, Itron, October 2, 2007. Page 11-10 |
1160-04 |
SCE |
Proc |
Single-Family EE Rebates - SCEProc | ||
1505-04 |
PG&E |
Proc |
Residential EE | ||
1453-04 |
SCE |
Proc |
Small Nonresidential Hard to Reach Program |
0.48 GWh 0.75 MW |
Evaluation of the SCE 2004-05 Small Business Energy Connection Program, April 2, 2007; EcoNorthwest Table ES-6 |
C - Programs with only draft evaluation results
As of July 2009, the impact evaluation report for the VeSM program has yet to be finalized, but draft savings results are available. This program represents less than 1% of the expected savings for the 2004-2005 cycle.
D - Programs without completed evaluations
Four programs included in this analysis did not have a final or draft evaluation, for which ex-ante savings were adopted without adjustment. These were SCE's Small Business Lighting Campaign which was part of the summer initiative programs, and three of PG&E's pilot programs (Upstream Verified Charge and Airflow, Food Service, and Silicon Valley Leadership Group).
5.2.2. 2004-2005 Savings Results
Based on the rules outlined above, Table 8 was developed. The full spreadsheet used to generate Table 8 is provided in Appendix D. The first column represents the 2004-2005 cumulative savings that were filed by the utilities via workbooks posted on the EEGA website. The second column represents the cumulative savings provided in the evaluation reports, with the exceptions noted in the preceding text.
Table 8: 2004-2005 Cumulative Savings Estimates
Ex-Ante |
Ex-Ante |
[Draft VR] Ex-Post |
[Final VR] Ex-Post | |
EEGA Workbooks |
Annual Reports |
Evaluation Results |
Evaluation Results | |
PG&E |
|
|
||
GWh-Annual |
1,736.40 |
1,741.4 |
907.04 |
1011.6 |
MW |
335.5 |
356.9 |
193.58 |
216.8 |
MMTherm - Annual |
44.1 |
44.7 |
18.35 |
19.1 |
% GWh Goal |
117% |
117% |
61% |
68% |
% MW Goal |
104% |
110% |
60% |
67% |
% MMTherm Goal |
225% |
228% |
94% |
100% |
SCE |
|
|
||
GWh-Annual |
1,923.10 |
2,296.9 |
1079.54 |
1,498 |
MW |
579.7 |
529.4 |
204.87 |
270.5 |
% GWh Goal |
116% |
139% |
65% |
91% |
% MW Goal |
174% |
159% |
61% |
81% |
|
|
|
||
SDG&E |
|
|||
GWh-Annual |
611.9 |
632.4 |
365.82 |
342.6 |
MW |
115.5 |
121.3 |
63.98 |
59.3 |
MMTherm-Annual |
8.9 |
3.6 |
4.40 |
4.5 |
% GWh Goal |
114% |
118% |
68% |
64% |
% MW Goal |
115% |
120% |
64% |
59% |
% MMTherm Goal |
247% |
100% |
122% |
126% |
|
|
|
||
SCG |
|
|||
MMTherm-Annual |
26.1 |
26.3 |
11.1 |
11.1 |
% MMTherm Goal |
135% |
136% |
58% |
58% |
5.2.3. Impact tables which include savings realized after 2005
A handful of programs have evaluation reported annual savings estimates that increase after 2005. This appears to be due to program extensions, late start-ups, and projects that were implemented after the 2005 programs closed. Table 9 lists the programs for which the evaluation reported annual savings estimates are realized after 2005.
In the comments presented by the utilities on the draft 1st Verification Report, several expressed concern that the statewide Energy STAR New Homes and Savings by Design programs were not included in the list on table 9. They were not included because the impact tables in the evaluation for each of these programs did not include a ramp-up or ramp-down of savings. The annual savings were the same from 2004 - 2008.
There were no additional savings credited for Savings by Design or CA Energy STAR New homes for projects that may have been installed after 2005 but were not included in the May 2006 annual report (which includes commitments).
Table 9: Programs for which Annual Evaluated Savings are Greater in 2006 than in 2005
Programs |
Utility |
Funding |
Program Name |
1066-04 |
SCE |
PGC |
H&L Energy Savers - Performance4 |
1085-04 |
PG&E |
PGC |
Small Business Energy Alliance |
1086-04 |
SCE |
PGC |
Small Business Energy Alliance |
1487-04 |
SCG |
PGC |
ADM Mobile Energy Clinic |
1285-04 |
SDG&E |
PGC |
B.E.S.T - SDREO |
1301-04 |
SDG&E |
PGC |
San Diego Region Local Government Energy Efficiency |
1311-04 |
SCE |
PGC |
Residential Duct Services |
1327-04 |
SCG |
PGC |
Residential Duct Services |
1381-04 |
SDG&E |
PGC |
Retrocommissioning Program |
1500-04 |
SDG&E |
PGC |
Rebuild a Greener San Diego |
1383-04 |
SDG&E |
PGC |
San Diego City Schools Retrofit Partnership |
1320-04 |
SDG&E |
PGC |
Local Nonresidential Customer Energy Savings Bid |
1121-04 |
PG&E |
PGC |
Standard Performance Contract - PGE |
1347-04 |
SDG&E |
PGC |
Standard Performance Contract - SDGE |
1240-04 |
SCE |
PGC |
Standard Performance Contract - SCE |
For program evaluations in which the highest annual savings occurred after 2005 the annual savings reported after 2005, which includes all the savings attributable to 04-05 activities, are counted instead of the savings reported for 2005.
Note Table 10 for example. The cumulative annual savings for 04-05 activities is reported for Express Efficiency in the year 2005; for Residential Duct Services and SPC the total annual savings attributable to the 04-05 activities is achieved in 2006 and 2008 respectively. The savings counting toward the MPS are the highest annual savings reported in the evaluation impact tables.
Table 10: Examples of Savings Realized After 2005
2004 |
2005 |
2006 |
2007 |
2008 |
2009 | ||||
1133-04 |
PG&E |
Express - PGE |
MWh |
30,137 |
72,027 |
72,027 |
71,867 |
58,655.52 |
36,403 |
1327-04 |
SCG |
RDS |
MWh |
99 |
2,095 |
2,181 |
2,181 |
2,181 |
2,181 |
1121-04 |
PG&E |
SPC - PGE |
MWh |
18,699 |
81,602 |
94,449 |
150,041 |
150,371 |
150,358 |
The LIEE data used to calculate the IOU portfolio savings for 2005 come directly from table E3 of the "Impact Evaluation of the 2005 California Low Income Energy Efficiency Program Final Report."33 The savings data for 2004, 2006, 2007, and 2008 come directly from the IOU annual LIEE reports filed with the CPUC.34 After analyzing the annual LIEE reported claims and the 2005 LIEE evaluation report, Energy Division concluded that the effort required to adjust the claimed savings using the 2005 LIEE evaluation report in a valid manner was not possible for this interim report.
Demand impacts were not required and therefore not reported for 2004 and 2005 LIEE programs. Energy Division staff extrapolated demand impacts for those years by calculating the average ratio of demand over energy impacts for 2006 and 2007, and used that ratio to estimate the 2004 and 2005 demand impacts. These same ratios were used to estimate 2008 demand impacts. Table 11 provides the savings numbers used for the LIEE programs.
Table 11: 2004-2008 LIEE Program Savings
PG&E |
GWh |
MW |
MMTherms |
2004 |
20.13 |
4.14 |
0.87 |
2005 |
24.68 |
4.59 |
1.03 |
2006 |
27.92 |
6.01 |
1.45 |
2007 |
27.55 |
5.41 |
1.21 |
2008 |
23.21 |
4.78 |
1.13 |
SCE |
GWh |
MW |
MMTherms |
2004 |
15.29 |
3.32 |
N/A |
2005 |
18.00 |
2.92 |
N/A |
2006 |
26.76 |
5.81 |
N/A |
2007 |
21.14 |
4.59 |
N/A |
2008 |
25.92 |
5.62 |
N/A |
SDG&E |
GWh |
MW |
MMTherms |
2004 |
6.89 |
1.79 |
0.26 |
2005 |
4.64 |
0.80 |
0.15 |
2006 |
5.31 |
1.98 |
0.28 |
2007 |
4.43 |
0.65 |
0.22 |
2008 |
6.49 |
1.69 |
.32 |
SoCalGas |
GWh |
MW |
MMTherms |
2004 |
0.13 |
N/A |
1.03 |
2005 |
0.38 |
N/A |
0.71 |
2006 |
0.27 |
N/A |
0.83 |
2007 |
0.00 |
N/A |
0.89 |
2008 |
1.17 |
An Energy Division contractor performed an initial verification of the energy savings estimated to have resulted from the Pre-2006 Codes and Standards advocacy program. The EM&V verification report is provided in Appendix H. The verification for this report consisted of adjusting the savings originally estimated by the utilities by taking into account the change in construction rates, the time lag between when a permit is issued and construction is completed, and the effective date of appliance standards. Resulting adjustments to MPS metrics ranged from 72% for SCE MW to 109% for all therm savings realized in 2007. The claimed and adjusted savings numbers are provided in Tables 12 through 14.
Table 12: Interim Adjusted and Claimed Codes and Standards Advocacy Electricity Savings, GWh
Year |
Utility |
Title 20 |
Title 24 |
Total | ||||
Claimed |
Adjusted |
Claimed |
Adjusted |
Claimed |
Adjusted |
% of Claimed | ||
2006 |
PG&E |
23.7 |
21.4 |
14.2 |
12 |
37.9 |
33.4 |
88% |
SDG&E |
5.6 |
5 |
3.3 |
2.8 |
8.9 |
7.8 |
88% | |
SCE |
24.5 |
22.2 |
19.8 |
10.6 |
44.3 |
32.8 |
74% | |
SCG |
NA |
NA |
NA |
NA |
NA |
NA |
NA | |
2007 |
PG&E |
23.7 |
22.8 |
15.4 |
12.9 |
39.1 |
35.8 |
91% |
SDG&E |
5.6 |
5.3 |
3.6 |
3 |
9.2 |
8.4 |
91% | |
SCE |
25.7 |
24.7 |
18.4 |
11.8 |
44.1 |
36.5 |
82% | |
SCG |
NA |
NA |
NA |
NA |
NA |
NA |
NA | |
Table 13: Interim Adjusted and Claimed Codes and Standards Advocacy Demand Savings, MW
Year |
Utility |
Title 20 |
Title 24 |
Total | ||||
Claimed |
Adjusted |
Claimed |
Adjusted |
Claimed |
Adjusted |
% of Claimed | ||
2006 |
PG&E |
3.5 |
3.3 |
7.5 |
6.4 |
11 |
9.7 |
88% |
SDG&E |
0.8 |
0.8 |
1.8 |
1.5 |
2.6 |
2.3 |
88% | |
SCE |
3.8 |
3.5 |
8.6 |
5.4 |
12.4 |
9 |
72% | |
SCG |
NA |
NA |
NA |
NA |
NA |
NA |
NA | |
2007 |
PG&E |
3.7 |
3.6 |
8.2 |
6.5 |
11.9 |
10.1 |
85% |
SDG&E |
0.9 |
0.8 |
1.9 |
1.5 |
2.8 |
2.4 |
85% | |
SCE |
4.2 |
4.1 |
8 |
5.6 |
12.2 |
9.7 |
80% | |
SCG |
NA |
NA |
NA |
NA |
NA |
NA |
NA | |
Table 14: Interim Adjusted and Claimed Codes and Standards Advocacy Natural Gas Savings, MMtherms
Year |
Utility |
Title 20 |
Title 24 |
Total | ||||
Claimed |
Adjusted |
Claimed |
Adjusted |
Claimed |
Adjusted |
% of Claimed | ||
2006 |
PG&E |
0.6 |
0.6 |
0.4 |
0.4 |
0.9 |
1 |
96% |
SDG&E |
0.1 |
0.1 |
0 |
0 |
0.1 |
0.1 |
96% | |
SCE |
NA |
NA |
NA |
NA |
NA |
NA |
NA | |
SCG |
0.9 |
0.9 |
0.6 |
0.7 |
1.5 |
1.6 |
105% | |
2007 |
PG&E |
0.5 |
0.5 |
0.3 |
0.4 |
0.8 |
0.9 |
109% |
SDG&E |
0.1 |
0.1 |
0 |
0 |
0.1 |
0.1 |
109% | |
SCE |
NA |
NA |
NA |
NA |
NA |
NA |
NA | |
SCG |
0.8 |
0.8 |
0.5 |
0.7 |
1.3 |
1.5 |
109% | |
Since there was no verification report for 2008 savings that can be attributed to pre-2006 Codes and Standards advocacy work, no additional savings were applied in this analysis.
The objectives of the CPUC's Utility Audit, Finance, and Compliance Branch's (UAFCB) audit were to (1) assess the utilities' accounting system and procedures related to the energy efficiency programs and determine if expenditures were properly recorded and reported to the Commission, (2) determine if the utilities' compliance with Commission directives and internal policies for customer enrollment, energy education, installation costs and measures, inspections, (3) assess the utilities' effectiveness in implementing its energy efficiency programs and ascertain that the utility had adequate processes in place between itself and its contractors, (4) ascertain that the utilities internal control and management oversight within the energy efficiency programs were properly in place and executed, and (5) review actions taken by the utilities' on prior audit recommendations and findings.
The UAFCB analyzed and reviewed documents provided by the utilities', randomly sampled selected project files for supporting documentation of eligibility, for evidence of measure installations, inspections and costs data. The UAFCB also conducted reviews of post-inspection reports, had several correspondence and interviews with utility management, and performed such other procedures as deemed necessary in the circumstances.
An audit of the utilities' 2006-2007 energy efficiency costs resulted in the allowance of all cost items. Although the audit report identified a number of potential problems, these were not significant enough to warrant adjustments to the utilities' cost claims.
The absence of disallowances means that the results of this audit will not have an impact on the calculation of the PEB. The TRC and PAC calculations are therefore conducted with utility reported cost provided in the E3 calculators. The results of the full 2006-2008 audit are due November 2, 2009. For purposes of this 2nd Verification Report, Energy Division used the utilities' reported costs for 2008 in the PEB calculations.
Energy Division notes that "Incremental Measure Costs" or IMCs was one of the parameters that were to be updated per the January 11, 2006 ALJ Ruling in R. 01-08-028. For this second verification report, IMC was not updated in either the DEER update process or the financial and management audit process. The utilities were instructed to report ACTUAL incremental measures costs for custom measure in the September 5, 2005 ALJ Ruling in R. 01-08-028. Energy Division defaulted to the utility reported IMC values.
Since there are two sides to the performance basis equation, savings and costs, and since Energy Division's efforts were more focused on the energy savings side of the equation, there remains the possibility that the utility reported incremental measure costs could either be higher or lower when compared to actual market conditions, resulting in a final performance basis that could either go up or down.
6. METHODOLOGY FOR CALCULATING 2006-2008 SAVINGS AND BENEFITS
The total EE portfolio consists of 177 programs that report savings, totaling over 21,000 measures in the E3 spreadsheets and over 4 million records in the program tracking databases. In order to calculate the 2006 - 2008 savings, as directed in D.08-01-042, Energy Division replaced certain utility claimed values with new values derived from the EM&V field and survey work or the 2008 DEER update. This is referred to as "update" or "DEER update" throughout this report and is not to be confused with the process that resulted in the 2008 DEER Update values. To make this update process manageable, Energy Division limited the DEER updates to the 21 programs that were part of the verification study and together comprised approximately 76% of the portfolio impacts. Furthermore, the measures within these programs were only updated if they were part of the verification sample. As a rule, all other measures and all other programs have been "passed through" in the VRT (see 6.1, below), meaning that the utility-reported values in the E3 spreadsheet for these measures and programs were used in the final calculation of the PEB without modification. Within these program and measure combinations, a set of measure groups have been defined and selected for the verification study, as such, measures categorized within these measure groups were updated in the VRT.
Tables 15 and 16A list the programs and measures that were part of this update. An Excel workbook providing the measure group definitions is provided in Appendix L.
Table 15: Programs updated in this report (The numbers below are utility reported savings)
Program ID |
Program Name |
GWH |
% |
Cum % |
MW |
% |
Cum % |
MMTH |
% |
Cum % |
PGE2000 |
PG&E Res Mass Market |
2080 |
21% |
21% |
263 |
15% |
15% |
7 |
5% |
5% |
PGE2004 |
PG&E Fabrication |
197 |
2% |
23% |
25 |
1% |
17% |
23 |
16% |
21% |
PGE2080 |
PG&E Nonres Mass Markets |
1797 |
18% |
41% |
367 |
22% |
39% |
13 |
9% |
30% |
SCE2500 |
SCE Appliance Recycling |
215 |
2% |
43% |
39 |
2% |
41% |
|
|
30% |
SCE2501 |
SCE Residential Incentive |
1930 |
19% |
62% |
268 |
16% |
57% |
|
|
30% |
SCE2502 |
SCE Multifamily |
149 |
1% |
63% |
15 |
1% |
58% |
|
|
30% |
SCE2511 |
SCE Nonres Direct Install |
276 |
3% |
66% |
49 |
3% |
61% |
|
|
30% |
SCE2517 |
SCE Business Incentive Program |
770 |
8% |
74% |
149 |
9% |
69% |
|
|
30% |
SCG3507 |
SCG Express Efficiency |
|
|
74% |
|
|
69% |
35 |
24% |
55% |
SCG3510 |
SCG MF Rebate |
0.02 |
0% |
74% |
0.01 |
0% |
69% |
2 |
1% |
56% |
SCG3513 |
SCG Local Business Energy Efficiency Program |
|
|
74% |
|
|
69% |
12 |
8% |
64% |
SCG3517 |
SCG SF Rebate |
4 |
0% |
74% |
2 |
0.1% |
69% |
2 |
2% |
66% |
SDGE3010 |
SDGE Energy Savings Bids |
97 |
1% |
75% |
15 |
0.9% |
70% |
1 |
1% |
66% |
SDGE3012 |
SDGE Express Efficiency |
84 |
1% |
76% |
16 |
0.9% |
71% |
1 |
1% |
67% |
SDGE3016 |
SDGE Upstream Lighting |
309 |
3% |
79% |
28 |
1.6% |
73% |
|
|
67% |
SDGE3017 |
SDGE MF Rebate |
11 |
0.1% |
79% |
4 |
0.3% |
73% |
0.3 |
0.2% |
67% |
SDGE3020 |
SDGE Small Bus |
216 |
2.1% |
81% |
41 |
2.4% |
76% |
0.8 |
0.5% |
68% |
SDGE3024 |
SDGE SF Rebate |
12 |
0.1% |
81% |
10 |
0.6% |
76% |
0.5 |
0.3% |
68% |
SDGE3025 |
SDGE Standard Performance Program |
27 |
0.3% |
81% |
4 |
0.2% |
76% |
0.4 |
0.3% |
68% |
SDGE3028 |
SDGE Appliance Recycling |
25 |
0.2% |
82% |
4 |
0.2% |
77% |
|
|
68% |
SDGE3035 |
SDGE Mobile Home |
5 |
0.1% |
82% |
3 |
0.2% |
77% |
0.3 |
0.2% |
69% |
Table 16A: Measure Groups updated in this report
PGE |
SCE |
SDGE |
SCG |
Upstream Res Interior screw lighting |
Upstream Res Interior screw lighting |
Upstream Res Interior screw lighting |
C&I Steam trap |
Upstream C&I Interior screw lighting |
Upstream C&I Interior screw lighting |
C&I Linear fluorescent |
C&I Process - unknown |
C&I Process - unknown |
C&I Linear fluorescent |
C&I Lighting - measure unknown |
C&I Pipe and tank insulation |
C&I Interior screw lighting |
Res Recycle refrigerator |
C&I Cooling - measure unknown |
C&I Process boiler |
C&I Strip curtain |
C&I Process - unknown |
C&I High bay fluorescent |
C&I Greenhouse heat curtain |
.
The VRT is a Microsoft (MS) Access application developed by ED. The VRT was developed to allow Energy Division to calculate the MPS and PEB in an efficient, transparent, and repeatable manner. This application is used to compile and process two types of data:
A. IOU savings and cost claims. These were submitted as standard E3 spreadsheets for each program, covering all 2006-08 program activities through December 31, 2008. These E3 spreadsheets list savings and related parameters for each measure line item in the "input" sheet of each workbook. They also document program level savings, costs and net benefits. All data from all E3 spreadsheets were compiled and are part of the VRT application. The utilities submitted 248 E3 spreadsheets, covering activity for 210 programs.35 One hundred and seventy seven of these programs claimed savings. E3 spreadsheets were submitted for the other programs in order to document program costs.
B. Program tracking data. The VRT establishes a standardized program-tracking level data format. The format includes three types of data fields: IOU E3, IOU Program Tracking, and ED Update. For selected programs (that account for a combined 76% of the total portfolio savings claim), data records were compiled at the program tracking level, starting with the IOU program tracking submittals for 2006-08 and adding data from the matched IOU E3 spreadsheets and data developed by ED for adjusting installation rates, NTG, EUL and UES.
The VRT application supports the following verification activities:
A. Automated E3 Runs. Using either input line items from the E3 spreadsheets or program tracking records, the VRT can run the approved36 E3 calculator engines. As each program is run, the savings and net benefits results are accumulated.
B. Portfolio Summary. The VRT can summarize savings and net benefits across all runs, by IOU, and place these results in the RRIM calculator.37
Please refer to the VRT User's Manual in Appendix F for instructions on how to use the VRT to perform the Automated E3 runs and Portfolio Summary activities listed above. The full VRT and associated files are provided in Appendix R.
There are many parts to the VRT, but the core process involves a few key steps that are described in the following sections:
A. Populating the VRT with all Measures to be Updated (section 6.2)
B. Updating Measures in the VRT with Installation Rates and DEER Parameters (section 6.3)
C. Running the VRT to Calculate Adjusted Energy Savings and PEB Values (section 6.4)
These sections describe the methods used to calculate the utilities' savings and net-benefits using installation rates produced by the EM&V contractor's field and survey work, and using the 2008 DEER values for UES, NTG and EUL. Figures 3 through 6 illustrate this process at a high level. Each step is described in more detail below.
Figure 3: VRT Process Flow Chart
The box labeled "1st Contractor Verification Reports - Use Same Installation Rates" in Figure 3 is examined in more detail in Figure 4 below. The measure group specific installation rates were derived from the 2006-2007 contractor verification studies and applied to the measures that comprise the programs selected for this update. The installation rates found in the verification studies may differ from the installation rates used in the VRT due to differences in how clerical errors found in the utilities' program tracking databases and E3 spreadsheets were treated in the EM&V contractor verification studies. Finally the installation rates were applied to the corresponding measures in the Verification Table of the VRT. Once this was done, the VRT calculations were based on the ED updated installation counts that were adjusted by the installation rates.
Figure 4: Installation Rate to VRT flow chart
![]()
Install rates for measures for SDGE3025, SDGE3010, SCG3513, SCE2517

![]()
PGE Fab Verification Report
![]()
Install rates for measures for PGE2004
The box labeled "2008 DEER Ex-Ante Update - UES EUL NTG" in Figure 3 above is examined in more detail in Figures 5 and 6 below. The 2008 DEER Update UES values were compiled into a database referred to as the "Interim Database." The Interim Database was used to match UES values to specific measures. Once the matching of UES to measures was completed, the 2008 DEER Update values for the measures being updated were loaded into the VRT. Once this was completed, the VRT calculations were based on the ED updated UES values. Similarly, the 2008 DEER Update NTG and EUL spreadsheets were used to match NTG and EUL values to specific measures. Once the matching of NTG and EUL to measures was completed, the 2008 DEER Update values for the measures being updated were loaded into the VRT and the VRT calculations were based on the ED updated NTG and EUL values.
Figure 5: UES to VRT flow chart
 Figure 6: EUL/NTG to VRT flow chart
The verification table in the VRT was modeled after the "Input" sheet of the E3 spreadsheet and consists of 128 variables. This table is the core component of the VRT as it contains measure level values from the E3 spreadsheet, the program tracking databases and the Energy Division updates.
Each of the 128 variables has a specific set of rules that were applied when the verification table was populated. As an example, the following rules were applied to the variable, "climate zone," which has a value from the utility E3 spreadsheet, the utility program tracking database, and an ED updated value.
_ First, the climate zone value from the E3 spreadsheet was entered into the variable called IOUE3ClimateZone;
_ Next, the climate zone value from the utility program tracking database was entered into the variable called IOUPrgTrkClimateZone;
_ Then a zip code entered into the variable IOUPrgTrkSiteZIPCode was matched using a zip-code-to-climate-zone lookup table;
_ If there was a match, then the associated climate zone was used as the value for the variable EDUpdatedClimateZone;
_ If there was no match, then the value was set to the value in the variable IOUPrgTrkClimateZone;
_ If IOUPrgTrkClimateZone was missing, the value was set equal to that in the variable IOUE3ClimateZone;
_ Finally, if none of the above rules worked, the value was set to "System."
Complete documentation of the rules are included as part of Appendix R in the file entitled "VRT_DB_Fields_MarkUp(v.4_5_4).doc".
In addition to applying a consistent set of rules, there was a significant amount of data mapping between the program tracking database records and the E3 spreadsheets prior to populating the Verification Table in the VRT. Each program tracking database record was associated with one of the input measure line items in the utility E3 spreadsheets so that certain data values not present in the program tracking data, e.g., incremental cost, could be associated with a value found in the E3 spreadsheet.
Numerous adjustments and calculations were required in order to successfully map program tracking data to the E3 spreadsheets. The following list is a general summary of the procedures undertaken during this mapping exercise:
A. SDG&E/SoCalGas measures were mapped by matching "Measure Codes" provided in the program tracking data with the first part of the "Measure Name" in the E3 spreadsheets;
B. SCE measures were mapped based on a number of fields including "DEER RunID," "Climate Zone," "Target Sector" and "Measure End Use Shape";
C. PG&E measures were mapped by collapsing the list of measures in the E3 spreadsheet to unique records of measure name, climate zone, and EUL. The measure names in the program tracking database were an exact match with the measure names in the E3 spreadsheets. The climate zones in the tracking database were labeled with a "Z" preceding the number, e.g. "Z10" for climate zone 10. By using the number portion of the climate zone or a "System" value, the climate zones were mapped. The EUL values found in the E3 spreadsheet were mapped to the tracking data using a combination of the building type and measure name from the tracking data;
D. Measure names were sometimes transposed and had to be corrected so that measure names in the E3 spreadsheets matched program tracking database measure names;
E. Some measure records in the program tracking database required summation to create a unique key to link back to the measures in the E3 spreadsheet;
F. Some date fields used to allocate quarterly quantities had to be cleaned and reformatted; generally the "installation date" field in the program tracking database was used to determine the quarter in which each measure was installed;
G. Some of the "unit definition" fields had to be cleaned up in order to properly match records. For instance, the "units" for the electric and dual-fuel measures were set to GWh, and the "units" for the gas measures were set to therms.
H. Mapping the proper measures values for upstream lighting required the use of "System" climate values for PG&E and SDG&E since there is not information of delivery area (retail outlet where bulbs were sold) as was provided in the SCE tracking data.
Once the mapping was complete, and the rules consistently applied, the verification table was functional within the VRT, in other words, the VRT was able to properly reference the values in the verification table, perform the automated E3 runs and generate a portfolio summary file.
To illustrate which fields are selected by the VRT in the final calculation, the NTG and EUL fields are described in Table 17:
Table 17: Example of EUL and NTG data fields in the VRT
Verification Table Fields |
Sample Values |
Description |
IOU_E3_Ex_Ante_EUL |
7 |
The EUL for this measure in the E3 file was seven years |
IOU_PrgTrk_Ex_Ante_EUL |
7 |
The EUL for this measure in the utility tracking database was also seven years |
ED_Updated_Ex_Ante_EUL |
7 |
Based on the information known for this measure, the 2008 DEER ex-ante update EUL was also seven years |
IOU_E3_Ex_Ante_NTGR |
.8 |
The NTG for this measure in the E3 file was .80 |
.8 |
The NTG for this measure in the utility tracking database was also .80 | |
ED_Updated_Ex_Ante_NTGR |
.64 |
Based on the information known for this measure, the 2008 DEER ex-ante update NTG was .64 |
By referencing both the program tracking database and E3 spreadsheet data sources, the changes made by ED (fields that begin with "ED_Updated") are more transparent and reviewable. In the example above, both the E3 spreadsheet and program tracking database records show an EUL of seven years for a particular measure. This is captured in the VRT under the fields IOU_E3_Ex_Ante_EUL and IOU_PrgTrk_Ex_Ante_EUL. The updated EUL for this particular measure, based on the 2008 ex-ante DEER Update EUL spreadsheet, is also seven years. This updated value is captured in the VRT under the field, ED_Updated_Ex_Ante_EUL. The values in this field are referenced by the VRT when the final PEB values are calculated.
In the EUL scenario, there is no change between the utility reported values and the Energy Division updates, but in the NTG example, the ED_Updated_Ex_Ante_NTGR is now .64, down from the utility reported value of .8 for both IOU_E3_Ex_Ante_NTGR and IOU_PrgTrk_Ex_Ante_NTGR. The .64 value is based on the 2008 DEER Update NTG spreadsheet, and will be the value that is referenced by the VRT when the final PEB value is calculated.
6.3. Updating Measures in the VRT with Installation Rates and DEER Parameters
6.3.1. Methodology for Updating Installation Rates in the VRT
The installation rate is a variable (EDInstallRate) in the Verification Reporting Template, which is used to adjust the claimed quantity for the population of measures covered by the verification study for each IOU.
The calculation of EDInstallRate for downstream measure groups is different than that for upstream measure groups (most notably CFLs). Each calculation is described below, followed by a description of the treatment of the measure groups that were excluded from the Verification Study.
6.3.1.1. Installation Rate: Downstream Measure Groups
For each sampled case ("i") from the program tracking databases, the quantity based on the verification survey inspections (EDInspectionExAnteQuantity) is divided by the quantity found in the IOU-supplied hardcopy project files for that same case. Equation 1 below illustrates this calculation.
![]() (1)
(1)
Where:
EDInstallRatei= |
The installation rate for the ith case |
EDInspectionExAnteQuantityi= |
The result of the ED on-site verification of installation for the ith case |
EDFileReviewExAnteQuantityi= |
The result of the review of the hardcopy project files of the rebated measure or project for the ith case |
When the quantity for a given sampled case in the program tracking database did not agree with the quantity in the hardcopy project files for the same case, the quantity in the hardcopy project files (EDFileReviewExAnteQuantity) took precedence. The rationale for doing this is that the number of units that a verification surveyor expected to see is represented in the EDFileReviewExAnteQuantity, which is based on a review of the hardcopy project files listing the specific measures, the size of the rebate for each measure, and a record of payment being made to the customer. Therefore, the values in EDFileReviewExAnteQuantity were assumed to be more accurate.
One of the original goals of the Contractor Verification Report was to correct clerical errors (e.g., an incorrect quantity or savings number is entered into the program tracking database) and incorporate the correction into the EDInstallRate. This level of review could only be completed for a small proportion of measures and programs. Thus, the EDInstallRate is mostly based on verified and utility claimed installations, where the utility claimed installations and savings estimates may contain an unknown number of data entry errors.
An overall savings-weighted installation rate is calculated based on the results across all sampled cases. For each case, the ex-ante gross GWh savings in the program tracking database (IOUPrgTrkExAnteGrSavGWhi) is multiplied by the EDInstallRatei. The result is then summed across all sampled cases and divided by the sum of the ex-ante gross GWh savings (IOUPrgTrkExAnteGrSavGWhi) across all sampled cases. Equation 2 illustrates this calculation.
 (2)
(2)
where
EDInstallRate= |
The overall savings-weighted installation rate for a given measure group or stratum |
EDInstallRatei= |
The installation rate for the ith case |
IOUPrgTrkExAnteGrSavGWhi= |
The ex ante gross savings in the IOU program tracking database for the ith case |
These samples are typically stratified random samples or simple random samples. In situations where simple random samples were drawn, the weighted installation rate is used to adjust the quantity variable (EDFilledExAnteQuantity) for each case in the population from which the sample was drawn. In situations where stratified designs were employed, the installation rate within a given stratum was used to adjust the quantity variable (EDFilledExAnteQuantity) for each case in the stratum population from which the sample was drawn. The resulting variable from these calculations (EDUpdatedExAnteQuantity) was then spread, using various date variables available in the program tracking databases, across the 12 quarters for 2006 - 2008.
6.3.1.2. Upstream Screw-In CFLS
The EDInstallRate for upstream screw-in CFLs and lighting fixtures for the residential and small commercial sectors was based on telephone interviews.
6.3.1.3. Residential Screw-In CFL Installation Rates
The installation rate characterizes the in-service rate for screw-in CFLs. The in-service rate is defined as the percent of purchased screw-in CFLs that are actually installed. The number of bulbs (IOUPrgTrkExAnteQuantity) recorded in the program tracking databases as shipped from manufacturers to participating retailers are adjusted using the EDInstallRate.
The EDInstallRate is estimated for each of the three electric utilities based on telephone surveys of a random sample of the population of residential customers. Respondents were asked whether they had purchased screw-in CFLs and, if they had, what percentage they had actually installed at a residence located within the utility's service territory.
The EDInstallRate does not include any adjustments for leakage (utility rebated products that leave the service territory) or adjustment for lamps that are placed in storage rather than being immediately used.
6.3.1.4. Nonresidential Screw-In CFL Installation Rate
For the purposes of the analysis covered by this report, the in-service rate for nonresidential lamps and lighting fixtures was set to 1.0. This assumption is known to be higher than actual and will be trued-up as part of the ongoing program evaluation.
6.3.1.5. Installation Rates: Excluded Measure Groups
Two classes of measure groups were excluded from any adjustments to their reported quantities:
A. Programs that contained one or more measure groups that were selected for verification also contained measure groups that were not selected for verification because of their relatively small savings. For such measure groups, the default value of 1.0 was assigned to the EDInstallRate and applied to the quantity variable (EDFilledExAnteQuantity) for the population of all measures within the given program's program tracking database.
B. For programs whose measure groups were not subjected to any verification, the default value of 1.0 was assigned to the EDInstallRate and applied to the quantity variable (EDFilledExAnteQuantity) for the population of all measures within a given program's program tracking database.
All of the verification reports can be found in Appendix A of this report.
6.3.2. Methodology for Updating EUL and NTG Values in the VRT
The following files were used to create lookup tables to update tracking level data with updated Net-To-Gross and Effective Useful Life values:
To update NTG values, each unique measure name must have a corresponding market sector, market segment, end-use, and program delivery channel:
Market Sector Nonresidential, Nonresidential - New Construction, Residential, Residential - New Construction
Market Segment All, Agricultural, Multi-family, Single-family
End-use All, Appliances, Building Shell, Custom Measures, HVAC, HVAC and Building Shell, HVAC/Water Heating, Lighting, Local Government Partnership, Milk Cooling, Motors, Refrigeration, Retro-commissioning, Water Heating, Whole Building
Program Delivery All Design Strategies, Building Design Incentive, Custom Incentive, Custom Rebate Based on Performance, Direct Install, Direct Installation, Downstream Prescriptive Rebates, Downstream Prescriptive Rebate and Direct Install, External Financing, Free Tune-up/Repair, New Innovative Delivery Strategies Designed to Minimize Free Ridership OR Direct Installation for Hard-to-Reach Customers, On-line Audit, On-site Audit, Prescriptive Rebate, Remote Audit via Phone/Mail-In/On-Line or CDROM approach, Retro-commissioning, Turn-in/Recycling, Upstream Prescriptive Rebate, Upstream Prescriptive Rebate - All channels, Various
Once this information is known, a lookup table can be created for each unique measure:
Measure Name |
Program |
HI EFF CLOTHES WSHER LVL 2=T-3B MEF=1.8 EF=5.5 1.5 2.65 3.5 CF |
PGE2000 Res Appliances |
In this example, the sector is "residential," the end-use is "appliances," and the unique measure is a "High Efficiency Clothes Washer." By filtering the "Updated DEER NTG Values for 2006-07 final 2008-10-10.xls" file for by these three parameters, the updated NTG value is either 81% or 85%. Since the unique measure name indicates that the "MEF = 1.8", the correct NTG value to update is 81% for Clothes Washer with a Modified Energy Factor > 1.72, as shown below:

After NTG values are assigned, a member of the DEER team reviews the lookup table for accuracy. The results of this exercise are then merged with the data in the verification table.
6.3.2.2. EUL Update
To update EUL, each unique measure must have a market sector and end use (for lighting measures, the EUL varies by building type - see Rule 4 below).
Market Sector Residential, Non-Residential
End-use Agriculture, Appliances, Building Envelope, Cooking, HVAC, HVAC - Boilers, HVAC - Chillers, HVAC - Miscellaneous, HVAC - Other Central Plant, HVAC - Split/Package, Indoor Lighting, Miscellaneous, Motors, Office Equipment, Outdoor Lighting, Plug Loads, Process Heating, Refrigeration, Water Heating
Using the same "High Efficiency Clothes Washer" example above, the "EUL_Summary_10-1-08.xls" table can be filtered for the residential appliances to determine that the EUL updated value for this measure should be 11 years:
Market |
Enduse |
Measure |
DEER06-07 Update EUL |
Residential |
Appliances |
High Efficiency Clothes Washer |
11 |
However, not all measures are this straightforward, so the following rules apply when performing this exercise:
Rule 1 Custom Measures:
DEER does not provide EUL values for custom/process measures, therefore ED uses the EUL value from the program tracking databases for custom or process measures.Rule 2 Rated Life:
DEER requires knowledge of the rated life of a lamp in order to select an EUL value for CFLs. If the rated life cannot be determined from the program tracking database information, ED assumes a rated life of 10,000 hours for the purpose of assigning an EUL value.Rule 3 Non-DEER Measures:
When the measure cannot be found in DEER, the default is to use the EUL value provided in the utility workpapers. For example a measure called "Pool Pump Reset Agreement" is part of the verification study but this technology is not included in the DEER update. Therefore, the EUL for this measure defaults back to the workpaper level. If nothing is in the workpaper, the default is to the program tracking data level EUL.Rule 4 Lighting Measures:
For both residential and nonresidential lighting measures, the EUL varies by building type, and is calculated by the following formula:EUL = [Rated Life] / [Annual Usage based on building type] or 15 years, whichever is less.
For the "annual usage based on building type," the building types assignments used for applying UES (described below in section 6.3.3. Methodology for Updating UES Values in the VRT ") should be the same building type assignments used for calculating EUL.
After EUL values are assigned, a member of the DEER team reviews the lookup table for accuracy. The results of this exercise are then merged with the data in the verification table.
6.3.3. Methodology for Updating UES Values in the VRT
2008 DEER Update Unit Energy Savings (UES) values for energy, demand, and gas savings were added to the program tracking data for the 21 programs updated in this report. This process was completed by developing a standard-format tracking database for all of the 21 programs - known as the Interim Database. The interim database is a merge of the utility tracking databases with standardized field names and standardized data dictionaries. Development of the interim database was necessary because the utilities' program tracking databases do not use consistent structures, fields, and data definitions across utilities and with DEER. Development of the interim database is described in greater detail in Appendix J - Addendum 2.
The main data inputs used to develop the interim database and assign the 2008 DEER Update UES values were:
· Program tracking data for all of the 21 programs, provided by the EM&V contractors evaluating those programs;
· The 2008 DEER database (version 2008.02.04), accessed with an interface program called MISer, both available on the DEER website at www.deeresources.com;
· Zip code to climate zone maps, from the CPUC; and
· NAICS codes tables, from NAICS41 (to determine building type).
To facilitate the assignment of 2008 DEER Update values, the utilities' program tracking data had to be mapped to the measure properties used in DEER. The 2008 DEER Update format requires the following general information to be known in order to select the correct savings values:
A. DEER Run IDs / DEER Measure IDs OR
B. Building type;
C. Climate zone; and
D. Measure Identification Information (Measure ID)
Once this information is known, the measures can be assigned DEER UES values.
Where this information was available in the program tracking databases, the format may have been converted to be consistent with the DEER structure. Where this information was not available in the program tracking databases, new data fields were created from existing program tracking database data or were assumed.
Several assumptions had to be made due to insufficient data in the program tracking databases when compared to the level of detail in DEER. For example, information about the base case was not given in the program tracking data.
The assumptions used were:
· All measures were assumed to have a base case of "Customer Average."
· All buildings were assumed to have the average building vintage for the utility.
· Program tracking database cases with the building type "residential multi-family" were not assigned 2008 DEER Update values, as DEER does not currently contain any values for multi-family installations.
· Only measures that are included in the latest version of the 2008 DEER Update were included as possible measures to be mapped. Several measure groups represented in the program tracking database are not yet included in the 2008 DEER Update.
· For line items that could not be assigned a particular DEER Building type based on NAICS code or program tracking database building descriptions, program information was used to either assign a default or a weighed DEER building type.
The tracking data from all utilities was first organized into a single table (see Table 18 for metadata). The table has 3.3 million line items, representing the installation of 379 million measure units. More details are provided in Appendix J.
Table 18: Basic Statistics on the combined program tracking system table
IOU |
Count of Lines |
Count of Measures |
Ex Ante Gross Savings GWh |
Ex Ante Gross Savings MW |
Ex Ante Gross Savings therms |
PGE |
1,303,192 |
104,351,236 |
4,828,398,234 |
759,424 |
53,708,158 |
SCE |
1,622,880 |
46,101,413 |
4,196,968,583 |
612,161 |
- |
SCG |
175,607 |
44,908,972 |
4,318,725 |
2,285 |
55,699,366 |
SDGE |
211,902 |
183,905,447 |
955,555,156 |
148,069 |
6,652,216 |
Total |
3,313,581 |
379,267,068 |
9,985,240,697 |
1,521,939 |
116,059,740 |
Some of the tracking data had DEER Run IDs or DEER Measure IDs that facilitated a direct mapping to the 2008 DEER Update values. Table 19 shows the number of line items in the tracking data that had valid DEER Run IDs or valid DEER Measure IDs.
Table 19: Count of DEER Run IDs and DEER Measure IDs in Tracking Data
Utility |
Line Items with DEER Run ID |
% Of line items with DEER Run ID |
Line Items with DEER Measure ID |
% of Line Items with DEER Measure ID |
Total Line Items |
SCE |
84,121 |
8% |
- |
0% |
1,041,774 |
SCG |
60,085 |
85% |
69,675 |
98% |
70,985 |
SDGE |
59,026 |
50% |
59,026 |
50% |
118,651 |
PGE |
- |
0% |
192,824 |
29% |
671,618 |
Totals |
203,232 |
11% |
321,525 |
17% |
1,903,028 |
There are 23 DEER commercial building types used to lookup impact data. The existence of valid building type data varied considerably by program. Therefore, a table was created to map all unique combinations of building type and NAICS code in the program tracking databases to a DEER building type field.
The building type table was created with the following steps:
A. A list of default building types was created for each program according to known characteristics of the program.
B. A map of program tracking database records to DEER building types was created.
C. A map of 4-digit NAICS codes to DEER building types was created.
D. DEER building types were assigned to the program tracking database records according to the following logic:
o The program tracking database building type was used if the program tracking database building type was able to be mapped to a DEER building type.
o The NAICS code derived building type was used if the program tracking database building type was not used, but a valid NAICS value was available.
o If neither the program tracking database building type nor the NAICS code derived building type could be mapped to a DEER building type, then the program based defaults were used.
A climate zone table was created in order to map program tracking database zip codes and climate zones to the list of standard climate zones that are in the 2008 DEER Update. All unique combinations of zip codes and climate zones that were in the original program tracking database were mapped.
The climate zone table was created with the following steps:
1. Valid zip codes in the program tracking database were reformatted to be numeric values between 90001 and 96162.
2. Valid climate zone values were reformatted to be numeric values between 1 and 16.
3. Default climate zones were created.
4. DEER climate zones were assigned to the program tracking database records using similar logic used as was used for building types.
A measure ID table was created in order to map the program tracking database measures to DEER Technology IDs using the measure description, sector, and savings units provided in the program tracking databases. Generally, a measure was mapped if the total gross program tracking database savings associated with the unique measure description constituted greater than 1% of the total portfolio savings.
If the program tracking database measure description was adequately descriptive, the measure was mapped to a DEER Technology ID. Program tracking database savings unit definitions were converted to be consistent with the unit definitions in DEER.42
The DEER MISer tool was used to extract essential data on all measures from the 2008 DEER Update. This data was then formatted into a table containing the essential fields needed to match tracking data line items to DEER to be used to look up UES values.
Due to the high level of data complexity, as well as the large number of line items and table relationships, the entire Interim Database, including all lookup tables and additional code, was modeled using SAS software. The Interim Database was updated to include 2008 DEER Update non-interactive savings values for the targeted measures. Wherever a match between program tracking data and DEER was possible, the new value was added into the VRT data field labeled EDDEERExanteGrUnitUESav (GWh, MW and therms).
For the Final Energy Division Verification Report, three sets of Interim Databases were created:
1. Interim DB using non-interactive (end use) DEER 06-08 UES numbers
2. Interim DB using interactive (whole building) DEER 06-08 UES numbers
3. Interim DB using interactive (whole building) DEER 06-08 UES numbers, but eliminating any negative therm interactive effects
A summary of the results of the UES assignment for each of the above datasets is presented in Table 20.
Table 20: Change in Savings due to UES Update by Program
|
Positive Interactive |
|
|
Interactive |
|
|
Non-Interactive |
|
|
ProgramID |
Change in kWh |
Change in kW |
Change in Therms |
Change in kWh |
Change in kW |
Change in Therms |
Change in kWh |
Change in kW |
Change in Therms |
PGE2000 |
-403,833,068 |
86,941 |
-427,453 |
-403,833,068 |
86,941 |
-50,551,125 |
-545,815,576 |
-50,243 |
-427,453 |
PGE2004 |
0 |
0 |
0 |
0 |
0 |
0 |
0 |
0 |
0 |
PGE2080 |
-176,945,598 |
-3,284 |
0 |
-176,945,598 |
-3,284 |
-9,323,693 |
-357,207,859 |
-62,271 |
0 |
SCE2500 |
-124,531,920 |
-17,871 |
0 |
-124,531,920 |
-17,871 |
-5,109,062 |
-147,220,896 |
-34,570 |
0 |
SCE2501 |
-113,625,595 |
112,618 |
0 |
-113,625,595 |
112,618 |
-32,668,163 |
-310,965,483 |
-25,126 |
0 |
SCE2502 |
-1,233,083 |
2,432 |
0 |
-1,233,083 |
2,432 |
-669,845 |
-3,750,719 |
-17 |
0 |
SCE2511 |
-12,299,401 |
-2,424 |
0 |
-12,299,401 |
-2,424 |
-122,331 |
-17,412,388 |
-3,862 |
0 |
SCE2517 |
-26,529,413 |
-6,072 |
0 |
-26,529,413 |
-6,072 |
-170,869 |
-32,726,593 |
-7,543 |
0 |
SCG3507 |
0 |
0 |
0 |
0 |
0 |
0 |
0 |
0 |
0 |
SCG3510 |
0 |
0 |
0 |
0 |
0 |
0 |
0 |
0 |
0 |
SCG3513 |
0 |
0 |
0 |
0 |
0 |
0 |
0 |
0 |
0 |
SCG3517 |
0 |
0 |
-43,542 |
0 |
0 |
-43,542 |
0 |
0 |
-43,542 |
SDGE3010 |
0 |
0 |
0 |
0 |
0 |
0 |
0 |
0 |
0 |
SDGE3012 |
-14,039,343 |
-2,063 |
0 |
-14,039,343 |
-2,063 |
-161,961 |
-16,693,076 |
-2,869 |
0 |
SDGE3016 |
-38,707,487 |
16,192 |
0 |
-38,707,487 |
16,192 |
-5,796,353 |
-57,716,220 |
-4,101 |
0 |
SDGE3017 |
-618,373 |
354 |
0 |
-618,373 |
354 |
-159,726 |
-1,088,311 |
-216 |
0 |
SDGE3020 |
-21,119,249 |
-1,360 |
0 |
-21,119,249 |
-1,360 |
-329,912 |
-33,409,881 |
-5,318 |
0 |
SDGE3024 |
0 |
0 |
-23,858 |
0 |
0 |
-23,858 |
0 |
0 |
-23,858 |
SDGE3025 |
0 |
0 |
0 |
0 |
0 |
0 |
0 |
0 |
0 |
SDGE3028 |
-31,185,688 |
-2,783 |
0 |
-31,185,688 |
-2,783 |
-773,551 |
-34,101,040 |
-5,607 |
0 |
SDGE3035 |
228,189 |
341 |
-88,929 |
228,189 |
341 |
-88,929 |
228,189 |
341 |
-88,929 |
-964,440,028 |
183,021 |
-583,782 |
-964,440,028 |
183,021 |
-105,992,923 |
-1,557,879,854 |
-201,404 |
-583,782 | |
Total Portfolio |
-9.66% |
12.03% |
-0.50% |
-9.66% |
12.03% |
-91.33% |
-15.60% |
-13.23% |
-0.50% |
Once the verification table is populated with updated parameters, the VRT has the capability to calculate GWh, MW, and therm savings and TRC and PAC net benefits under two scenarios:
Scenario 1 - Utility installation counts, UES, NTG, and EUL values are unadjusted
Scenario 2 - Adjustments made to utility installation count, UES, NTG, and EUL values
6.4.1. Scenario 1 - Utility Installation Counts, UES, NTG, and EUL Values are Unadjusted
The VRT can produce GWh, MW, and therm savings and TRC and PAC net benefit values under Scenario 1 with two options that should produce similar results:
Option 0 - Utility calculated program level savings and net benefits from the E3 spreadsheet are simply added up
Option 1 - Utility measure level program level savings and net benefits from the E3 spreadsheet are recalculated using the VRT
The purpose of running Option 0 and Option 1 together is to compare the VRT calculation results to the utilities' program level calculations to confirm that the VRT is performing the calculation correctly.
By running the VRT with Option 0, the utility calculated GWh, MW, and therm savings and TRC and PAC net benefits from their E3 spreadsheet are simply aggregated across all programs. There is no re-calculation of the numbers filed by the utilities. The results from running the VRT using Option 0 are shown below in Table 21:
Table 21: VRT Ran with Option 0
PG&E |
SCE |
SDGE |
SoCalGas | |
EE Portfolio Savings (adjusted ex-ante) |
PY 2006-2008 | |||
Total Cumulative Savings (GWH) |
5,253.40 |
3,901.44 |
880.56 |
0.00 |
Total Peak Savings (MW) |
845.19 |
690.82 |
155.85 |
0.00 |
Total Cumulative Natural Gas Savings (MMTh) |
66.26 |
0.00 |
7.12 |
70.61 |
PEB |
|
|
|
|
TRC Net Benefits |
$ 1,979,630,874 |
$ 1,170,607,929 |
$ 288,847,192 |
$ 167,366,333 |
PAC Net Benefits |
$ 2,315,510,629 |
$ 1,563,514,570 |
$ 396,381,539 |
$ 325,807,930 |
Running the VRT with Option 1 recalculates GWh, MW, and therm savings and TRC and PAC net benefits using the utility reported measures in the E3 spreadsheets with none of the values updated or adjusted in any way. The results from running the VRT using Option 1 are shown below in Table 22:
Table 22: VRT Ran with Option 1
PG&E |
SCE |
SDGE |
SoCalGas | |
EE Portfolio Savings (adjusted ex-ante) |
PY 2006-2008 | |||
Total Cumulative Savings (GWH) |
5,253.40 |
3,894.90 |
880.56 |
0.00 |
Total Peak Savings (MW) |
845.19 |
690.82 |
155.85 |
0.00 |
Total Cumulative Natural Gas Savings (MMTh) |
66.26 |
0.00 |
7.12 |
70.61 |
PEB |
|
|
|
|
TRC Net Benefits |
$ 1,979,630,874 |
$ 1,168,010,969 |
$ 288,814,086 |
$ 167,366,333 |
PAC Net Benefits |
$ 2,315,510,629 |
$ 1,560,917,329 |
$ 396,344,555 |
$ 325,807,930 |
Table 23 shows the percentage difference between the results from Table 21 compared to the results from Table 22:
Table 23: Percentage Difference = [Option 1 - Option 0] / [Option 0]
PG&E |
SCE |
SDGE |
SoCalGas | |
EE Portfolio Savings (adjusted ex-ante) |
PY 2006-2008 | |||
Total Cumulative Savings (GWH) |
0.00% |
-0.17% |
0.00% |
|
Total Peak Savings (MW) |
0.00% |
0.00% |
0.00% |
|
Total Cumulative Natural Gas Savings (MMTh) |
0.00% |
|
0.00% |
0.00% |
PEB |
|
|
|
|
TRC Net Benefits |
0.00% |
-0.22% |
-0.01% |
0.00% |
PAC Net Benefits |
0.00% |
-0.17% |
-0.01% |
0.00% |
The VRT thus was able to reproduce the utilities' own calculations for GWh, MW, and therms exactly for PGE, SCE demand, SDGE savings, and SCG. The calculations were off by -.17% (0.00168) for SCE GWh savings.
Similarly, the VRT was able to reproduce the exact calculations for TRC and PAC net benefits for PGE and SCG. The calculations were off for SCE by a fraction of a percent -.22% (0.00222) for TRC and -.17% (0.00166) for PAC. For SDGE both TRC and PAC net benefits were within -.01% (0.00009) of the utility reported value.
6.4.2. Scenario 2 - Adjustments Made To Utility Installation Count, UES, NTG, and EUL Values
The VRT can produce GWh, MW, and therm savings and TRC and PAC net benefit values under Scenario 2 through two options:
Option 2 - Updates to installation rates, UES, NTG, and EUL were made to measures at the E3 spreadsheet level
Option 3 - Updates to installation rates, UES, NTG, and EUL were made to measures at the program tracking database level
Of the 13 programs updated, 12 used Option 3 and only one (PGE2004) used Option 2. When running the VRT to calculate the adjusted GWh, MW, and therm savings and adjusted TRC and PAC net benefits, Option 2 and 3 are automatically combined.
For the this 2nd Verification Report, the results of Scenario 2 are provided using three different sets of data:
With Positive Interactive Effects Only
With Both Positive and Negative Interactive Effects
Without Interactive Effects
Table 24 shows the results of running the VRT using the combined output from Options 2 & 3 with Positive Interactive Effects Only:
Table 24: VRT Ran with combined Option 2&3 with Positive Interactive Effects Only |
||||
|
PG&E |
SCE |
SDGE |
SoCalGas |
EE Portfolio Savings (adjusted ex-ante) |
PY 2006-2008 | |||
Total Cumulative Savings (GWH) |
2,993 |
2,604 |
593 |
0 |
Total Peak Savings (MW) |
553 |
543 |
129 |
0 |
Total Cumulative Natural Gas Savings (MMTh) |
50 |
0 |
6 |
51 |
PEB |
|
|
|
|
TRC Net Benefits |
$ 970,752,340 |
$ 553,651,255 |
$ 102,184,527 |
$ 33,257,031 |
PAC Net Benefits |
$ 1,243,176,693 |
$ 910,821,824 |
$ 196,714,848 |
$ 179,305,000 |
Table 25 below compares the results from the combined Options 2 and 3 to the results from Option 1 and shows the percentage differences:
Table 25: Percentage Difference (with Positive Interactive Effects Only) = [Option 2&3 - Option 1] / [Option 1] | ||||
|
PG&E |
SCE |
SDGE |
SoCalGas |
EE Portfolio Savings (adjusted ex-ante) |
PY 2006-2008 | |||
Total Cumulative Savings (GWH) |
-43% |
-33% |
-33% |
|
Total Peak Savings (MW) |
-35% |
-21% |
-17% |
|
Total Cumulative Natural Gas Savings (MMTh) |
-24% |
|
-22% |
-28% |
PEB |
|
|
|
|
TRC Net Benefits |
-51% |
-53% |
-65% |
-80% |
PAC Net Benefits |
-46% |
-42% |
-50% |
-45% |
Table 26 shows the results of running the VRT using the combined output from Options 2 & 3 with both Positive and Negative Interactive Effects:
Table 26: VRT Ran with combined Option 2&3 with Both Positive and Negative Interactive Effects |
||||
|
PG&E |
SCE |
SDGE |
SoCalGas |
EE Portfolio Savings (adjusted ex-ante) |
PY 2006-2008 | |||
Total Cumulative Savings (GWH) |
2,993 |
2,604 |
593 |
0 |
Total Peak Savings (MW) |
553 |
543 |
129 |
0 |
Total Cumulative Natural Gas Savings (MMTh) |
27 |
0 |
2 |
51 |
PEB |
|
|
|
|
TRC Net Benefits |
$ 869,840,779 |
$ 471,870,976 |
$ 99,694,948 |
$ 33,257,031 |
PAC Net Benefits |
$ 1,142,265,133 |
$ 829,041,545 |
$ 194,229,240 |
$ 179,305,000 |
Table 27 below compares the results from the combined Options 2 and 3 with both Positive and Negative Interactive Effects to the results from Option 1 and shows the percentage differences:
Table 27: Percentage Difference (with Both Positive and Negative Interactive Effects) = [Option 2&3 - Option 1] / [Option 1] | ||||
|
PG&E |
SCE |
SDGE |
SoCalGas |
EE Portfolio Savings (adjusted ex-ante) |
PY 2006-2008 | |||
Total Cumulative Savings (GWH) |
-43% |
-33% |
-33% |
|
Total Peak Savings (MW) |
-35% |
-21% |
-17% |
|
Total Cumulative Natural Gas Savings (MMTh) |
-60% |
|
-65% |
-28% |
PEB |
|
|
|
|
TRC Net Benefits |
-56% |
-60% |
-65% |
-80% |
PAC Net Benefits |
-51% |
-47% |
-51% |
-45% |
Table 28 shows the results of running the VRT using the combined output from Options 2 & 3 without Interactive Effects:
Table 28: VRT Ran with combined Option 2&3 without Interactive Effects |
||||
|
PG&E |
SCE |
SDGE |
SoCalGas |
EE Portfolio Savings (adjusted ex-ante) |
PY 2006-2008 | |||
Total Cumulative Savings (GWH) |
2,894 |
2,497 |
568 |
0 |
Total Peak Savings (MW) |
481 |
471 |
115 |
0 |
Total Cumulative Natural Gas Savings (MMTh) |
50 |
0 |
6 |
51 |
PEB |
|
|
|
|
TRC Net Benefits |
$ 934,735,674 |
$ 499,257,175 |
$ 87,268,137 |
$ 33,257,031 |
PAC Net Benefits |
$ 1,207,160,028 |
$ 856,427,744 |
$ 181,798,459 |
$ 179,305,000 |
Table 29 below compares the results from the combined Options 2 and 3 without Interactive Effects to the results from Option 1 and shows the percentage differences:
Table 29: Percentage Difference (without Interactive Effects) = [Option 2&3 - Option 1] / [Option 1] |
||||
|
PG&E |
SCE |
SDGE |
SoCalGas |
EE Portfolio Savings (adjusted ex-ante) |
PY 2006-2007 | |||
Total Cumulative Savings (GWH) |
-45% |
-36% |
-36% |
|
Total Peak Savings (MW) |
-43% |
-32% |
-26% |
|
Total Cumulative Natural Gas Savings (MMTh) |
-24% |
|
-22% |
-28% |
PEB |
|
|
|
|
TRC Net Benefits |
-53% |
-57% |
-70% |
-80% |
PAC Net Benefits |
-48% |
-45% |
-54% |
-45% |
Refer to the VRT user's manual in Appendix F for instructions for producing results comparing the combined Option 2 and 3 to Option 1 for each individual program.
The values in Table 24 - Table 29 are entered into the RRIM Calculator together with the savings from the other program efforts described in section 4.1.1 to determine the appropriate earnings rate and calculate whether the utility will receive shareholder incentives or incur a penalty.
Knowledge of a measure's building type is required for assigning new UES values from DEER. ED assigned the building type "Single_Family_Residential" to all residential measures.
6.5.2. Nonresidential CFL hours of operation
For CFL measures, hours of use information is necessary for both EUL and UES updates. There are two methodologies used by the utilities to estimate hours of use:
1. Use all building types and take a straight average hours of use
2. Use a weighted average of the three most common building types
We opted for methodology #2, since it provides a more realistic estimate of the hours of use; specifically, we applied an equal 1/3 weighting to the following three non-residential building types: small office, retail, and sit-down restaurants.
6.5.3. DEER EUL and Rated Life
The EUL for CFLs is based on [rated life]/[annual hours of use]; if the rated life is not known, we gave the utilities the benefit of doubt and assumed a rated life of 10,000 hours. The range is between 6,000 and 12,000 hours. CFLs with a 12,000 hour rated life are rare, and utility workpapers show estimates of 9,200 hours. We believe the typical case in the current program environment is around 10,000 hours.
6.5.4. SPC Realization Rate for Custom Projects
DEER does not provide UES for custom or "process" measures. Rather than simply passing these values through as reported by the utilities, we applied a standard realization rate for custom/process measures based on a recently completed program evaluation study.43 "The 2004-2005 Statewide Nonresidential Standard Performance Contract Program Measurement and Evaluation Study"44 managed by SCE found a statewide gross realization rate of .79 for custom/process measures. The utility specific realization rates reported in the study vary, from .82 for GWh for PGE, to .77 for GWh for SCE, to .94 for GWh for SDGE, with no realization rate provided for SCG. The closest realization rate we found for SCG was from the "Evaluation of the Southern California Gas Company 2004-05 Non-Residential Financial Incentives Program,"45 which found a realization rate of .75 for therms for SCG. It should be noted that the individual utility sample sizes in the SPC study are small, with anomalies for each utility sample. However, in the interest of providing a judicious representation of realized savings, we decided to apply a statewide realization rate of .79 for electric, demand, and natural gas savings across all utilities for measure that are custom/process type measures rather than passing the reported value through unmodified.
6.5.5. SCE Quarterly Installation Count
ED found that SCE does not report actual installation counts per quarter in the E3 calculator; instead, SCE provides annual counts, and the quarterly counts are calculated by taking the annual installation counts and dividing by four. The other utilities provide actual installation counts by quarter. Quarterly installation counts support a more accurate calculation of the PEB because the avoided costs are calculated on net present value and installations tend to peak towards the end of the year. SCE's assumption that installations are spread evenly throughout the year was considered incorrect. In order to correct this assumption in the VRT, the following rules were applied:
The quantity for a given record in a given program tracking database was allocated to one of eight quarters based on the record's EDUpdatedPaidandInstalledDate. There were two rules regarding the EDUpdatedPaidandInstalledDate depending on whether it was an upstream or downstream program:
Rule #1: For downstream programs, for each record, the value for EDUpdatedPaidandInstalledDate was set to the IOUPrgTrkPaidDate, which represents the date the rebate check was prepared. There was only one exception where this could not be done, SCE2501. This small program did not have a month-year date value but only a year value (2007). For this program, the quantity was divided by four and spread evenly across the four quarters of 2007.
Rule #2: For upstream programs, the value for EDUpdatedPaidandInstalledDate was set to the IOUPrgTrkPaidDate, which represents the date that the payment to the manufacturer was authorized. For upstream measures, customer installations were assumed to occur within the same quarter that the payment to the manufacturer was authorized, i.e., there was no assumed lag between the date on which the payment to the manufacturer was authorized and the date on which the customer installed the measure.
6.5.6. Residential / Nonresidential Split Assumption for CFLs
In the workpaper entitled "Integral (Screw-In) Compact Fluorescent Lamp (CFL) Non-Residential" (WPSCRELG0022, Revision 0, dated December 18 2007),46 SCE assumes that 90% of the upstream CFLs are installed in residential buildings and 10% are installed in nonresidential buildings, citing an analysis of 1994 consumer mail-in survey data (manufacturer bounce back cards).47 PG&E uses the same 90%/10% installation split, but has not provided a workpaper to Energy Division to support this assumption. PG&E estimated that 100% of the upstream lighting products would go into residential buildings when the program was approved, but did not expressly notify Energy Division of the change to the 90%/10% residential/nonresidential split assumption. SDG&E, which implements essentially the same upstream lighting program, assumes that 100% of the upstream CFLs are installed in residential buildings.
Energy Division cannot validate the 90%/10% installation split assumption at this time for upstream CFLs sold for the following reasons:
A. There are likely to be significant differences between the 1994 programs, lighting products, and purchasing patterns compared to 2006-2008.
B. The extent to which the 1994 consumer mail-in survey data contains possible self-selection bias is not known.
C. Whether or not the 1994 consumer mail-in survey data were drawn from a random and representative sample of customers cannot be ascertained.
D. Customer survey data collected between 2004 and 200748 as part of the upstream lighting program evaluations suggest that the proportion of commercial customer purchases is likely to be between 3% and 7%.
E. Preliminary data from 06-07 in-store intercept surveys49 suggest that the volume of CFL purchased by nonresidential customers from retail channels is about 2%, but the data do not appear representative and conclusive at this time.
F. Surveys of recipients of CFLs given away at the events organized by IOUs in 2006-2007 show that 1-2% of CFLs given away are installed in nonresidential premises.50
G. The number of commercial building sockets which can receive CFLs (data available from the Commercial End Use Survey database) combined with the fraction of likely upstream commercial purchasers (in D above) does not appear to support more than 2-5% of the 2006-2007 upstream CFLs volume (>50,000,000 bulbs) being installed in non-residential buildings.
The data sources mentioned above strongly suggest that nonresidential installations of CFLs sold through upstream programs is far less than the 10% that PG&E and SCE have assumed. ED has therefore calculated GWh, MW and PEB for SCE, SDGE and PG&E assuming that 5% of upstream CFL products, rather than 10%, are installed in non-residential buildings (or that 100% of upstream CFL products are installed in residential buildings as SDGE assumed).
6.5.7. Handling of Audit Impacts
No adjustments were made to savings claimed as a result of audit programs.
The interior building load reduction/increase due to a measure installation in a facility can interact with the heating, ventilating and air-conditioning (HVAC) system, resulting in changes in the consumption of electricity or gas. These HVAC interactive effects can result in positive or negative changes in consumption, and can cross fuel types and energy/demand categories. This raises the general issue of how these interactions affect the total savings for the project, and thus the program. A second database in DEER calculates a separate total UES savings that includes HVAC interactive effects.
In comments during the Energy Division workshops and meetings, the utilities put forward arguments in favor of residential lighting and appliances not including any negative "interactive effects," but keeping positive "interactive effects" for non-residential measures.
SCE has been claiming no positive or negative interactive effects for CFLs in residential and non-residential settings. PGE and Sempra claim positive interactive effects for CFLs in non-residential settings, but they are not claiming negative interactive effects for those installations. In lieu of a specific Commission policy on the use of HVAC interactive effects, Energy Division decided to run three scenarios based on 1) DEER UES values with only positive HVAC interactive effects, 2) DEER UES values with all HVAC interactive effects, and 3) DEER UES values without any HVAC interactive effects
DEER provides multiple base case gross savings values for measures such as duct sealing and refrigerant charge and airflow. In determining which of these values to use when assigning a UES, Energy Division decided to select the "typical" value in DEER rather than calculating a value based on a combination of the typical and "high" case values.
7. CALCULATION OF SHAREHOLDER INCENTIVES
Energy Division developed a spreadsheet tool, the RRIM Calculator, to calculate the earnings or penalties for each utility using GWh, MW, and MMTh accomplishments and TRC & PAC net benefits from the VRT output and the savings from the other program efforts described in section 4.1.1. The RRIM Calculator is designed to calculate and track the 2006-2007 and 2008 interim incentives as well as the final three year cycle true-up.
The narrative below describes the purpose, method, and source data for each step of the calculation for the first interim claim only. Example formulas are taken from column C of the RRIM Calculator. The RRIM is provided as part of Appendix G.
Savings Goals
Location on Spreadsheet:
Rows 8-10.
Description:
The CPUC adopted GWh, MW, and MMTh savings goals for 2008. The goals for GWh and MMTh are cumulative as describe in section 6.3.1 of Decision 07-10-032.
Source of Data:
Decision 04-09-060, Attachment 9.
MPS Goals (80% of goal)
Location on Spreadsheet:
Rows 13-15.
Description:
For each individual metric, the point above which the IOUs can claim earnings based on the PEB.
Source of Data:
Calculated from Savings Goals
Dead Band (65% of goal)
Location on Spreadsheet:
Rows 18-20.
Description:
For each individual metric, the point above which the IOUs are not liable for payment of penalties.
Source of Data:
Calculated from Savings Goals
Functional Role in Spreadsheet:
Used to calculate the amount of penalties if penalties must be paid.
EE Portfolio Savings (adjusted ex-ante)
Location on Spreadsheet:
Rows 24-26.
Description:
The GWh, MW, and MMTh accomplishments for 2006 - 2008 EE programs.
Source of Data:
Sum of Annual Net GWh, Sum of Net Jul-Sept Pk (MW), and Sum of Annual Net Therms from the Output sheets of the E3 calculator output files produced by the VRT.
Functional Role in Spreadsheet:
A component of what is used to determine the percentage of the adopted goal that was achieved.
50% C&S Savings (adjusted ex-ante)
Location on Spreadsheet:
Rows 29-31.
Description:
The estimated GWh, MW, and MMTh accomplishments associated with the utilities' codes and standards advocacy work.
Source of Data:
Tables 3-5 in the Statewide Utility Codes and Standards Program Interim Verification Report
Functional Role in Spreadsheet:
A component of what is used to determine the percentage of the adopted goal that was achieved.
04-05 EM&V Adjusted EE Portfolio Savings
Location on Spreadsheet:
Rows 34-36.
Description:
The GWh, MW, and MMTh accomplishments for 2004 and 2005 EE programs. Ex-post numbers are used where available.
Source of Data:
A mix of program level ex-post results, as reported in final 2004-2005 program evaluation reports, and 2004-2005 IOU reported accomplishments where ex-post results are not available.
Functional Role in Spreadsheet:
A component of what is used to determine the percentage of the adopted goal that was achieved.
EM&V Adjusted LIEE Savings
Location on Spreadsheet:
Rows 39-41.
Description:
The GWh, MW, and MMTh accomplishments for 2004 through 2007 LIEE programs. The savings data for the 2005 LIEE program come directly from the final 2005 LIEE Impact Evaluation completed in December 2007. Savings for 2006 and 2007 have not been adjusted to be consistent with the findings of the 2005 LIEE Impact Evaluation. Savings data for 2004 are directly from the IOUs' 2004 LIEE Annual Report.
Source of Data:
A mix of program level ex-post results, as reported in final 2005 LIEE program evaluation report; 2004, 2006, and 2007 IOU reported accomplishments; and extrapolations of demand savings for 2004 and 2005.
Functional Role in Spreadsheet:
A component of what is used to determine the percentage of the adopted goal that was achieved.
Total Savings
Location on Spreadsheet:
Rows 44-46.
Description:
The sum of the GWh, MW, and MMTh accomplishments for EE Portfolio Savings, 50% C&S Savings, 04-05 EM&V Adjusted EE Portfolio Savings, and EM&V Adjusted LIEE Savings.
Functional Role in Spreadsheet:
Used to determine what percentage of the adopted goal was achieved.
MPS Individual Metric Performance
Location on Spreadsheet:
Rows 49-51.
Description:
The percentage of the individual adopted GWh, MW, and MMTh goals that are deemed accomplished.
Functional Role in Spreadsheet:
Used to determine what percentage of the adopted goal was achieved for each individual metric (GWh, MW, and MMTh).
MPS Average Metric Performance
Location on Spreadsheet:
Row 52.
Description:
The percentage of the average adopted GWh, MW, and MMTh goals that are deemed accomplished.
Functional Role in Spreadsheet:
Used to determine what percentage of the adopted metric goal was achieved on average.
TRC Net Benefits and PAC Net Benefits
Location on Spreadsheet:
Rows 55-56.
Description:
The Total Resource Cost and Program Administrator Cost avoided cost net benefits.
Source of Data:
Benefit - Cost NPV for Program TRC ($) and Program PAC ($) from the Output sheets of the E3 calculator output files produced by the VRT.
Functional Role in Spreadsheet:
Components of what is used to determine the Performance Earnings Basis for each IOU.
PEB
Location on Spreadsheet:
Row 57.
Description:
The Performance Earnings Basis. The metric adopted for measuring program performance. The metric is ((2/3)*(TRC net benefits))+((1/3)*(PAC net benefits)).
Functional Role in Spreadsheet:
Used as a basis for determining the amount of IOU earnings or penalties.
PEB at MPS Threshold
Location on Spreadsheet:
Row 58.
Description:
The Performance Earnings Basis, adjusted to accommodate the rules established for meeting the MPS threshold. The result is zero if the metric average or any of the individual metrics are below the adopted thresholds.
Functional Role in Spreadsheet:
Used as a basis for determining the amount of IOU earnings or penalties.
Function of Excel Formulas:
=IF(AND(C52>=0.85,C49>=0.8,C50>=0.8,C51>=0.8),C57,0)
This formula sets the cell equal to the PEB if the thresholds for the metric average and the individual metrics are greater than or equal to the adopted thresholds. If this condition is not met, the cell will equal zero.
Earnings/Penalty Cap
Location on Spreadsheet:
Row 60.
Description:
The three year earnings/penalties caps for each IOU adopted in D. 07-09-043.
Functional Role in Spreadsheet:
Used to cap the total earnings.
Earnings Rate
Location on Spreadsheet:
Row 62.
Description:
The rate at which the IOU may earn on the PEB.
Functional Role in Spreadsheet:
Used to determine the earnings rate.
Function of Excel Formulas:
=IF(AND(C52>=0.85,C52<1,C58>0),0.09,(IF(OR(C58=0,C52<0.85),0,(IF(AND(C49>=0.95,C50>=0.95,C51>=0.95,C52>=1),0.12,0.09)))))
This formula sets the cell to 9% if the metric average is equal to or greater than 85%, and all of the individual metrics are equal to or greater than 80% of the Commission-adopted savings goals. The cell is set to 12% if the metric average is equal to or greater than 100%, and all of the individual metrics are equal to or greater than 95% of the Commission-adopted savings goals. If neither of these conditions is met, the cell will be equal to zero.
Total Earnings
Location on Spreadsheet:
Row 64.
Description:
The total individual earnings that may be claimed by each utility.
Explanation of Formulas:
=MINA(C62*C58*0.65,C60)
This formula sets the cell to equal the Earnings Rate times the PEB at MPS Threshold, or the Earnings/Penalty Cap, whichever is lower.
Penalties
Location on Spreadsheet:
Row 66.
Description:
After all the required data are entered into the spreadsheet, the cell will be equal to "Yes" if penalties are required.
Functional Role in Spreadsheet:
To indicate whether or not penalties are required for the utility and, if so, cause the spreadsheet to calculate penalties.
Explanation of Formulas:
=IF(SUM(C44:C46)>0,(IF(OR(C55<0,C49<=0.65,C50<=0.65,C51<=0.65),"YES","NO")),0)
This formula sets the cell to "YES" if there are negative TRC net benefits or if any of the individual metrics are equal to or below 65%.
Total Penalties
Location on Spreadsheet:
Row 68.
Description:
The total individual penalties that should be assessed to each utility.
Explanation of Formulas:
The formulas were deleted since no penalties were required.
The results of the RRIM calculation are provided in Tables 30 - 32. The tables show the incentive earnings that the utilities are eligible to claim as second interim payment, based on the results in this 2nd Verification Report (i.e., utilities' achievement of the MPS and the estimated PEB), applying the 35% holdback from the total allowable earnings, and subtracting the first interim payments that the Commission approved in Decision 08-12-059. (The 35% holdback amount will be subject to the final true-up based on Energy Division's Final Verification and Performance Basis Report in March 2010, as per Decision 08-01-042.)
Based on the results of the analysis described in this report SDG&E is not eligible for an interim EE shareholder earnings payment for program years 2006-2008, regardless of the data scenario (Positive Interactive Effects Only, Both Positive and Negative Interactive Effects, or Without Interactive Effects). SoCalGas will not be eligible for a second interim payment regardless of the data scenarios since the first interim payment of $5.20 million authorized in Decision 08-12-059 is higher than total allowable earnings of $4.79 million calculated in this report. No utility is eligible for a second interim payment using the Without Interactive Effects data scenario.
If both Positive and Negative Interactive Effects are used PGE and SCE are eligible for second interim payments totaling $24,567,239. If only Positive Interactive Effects are used, PGE and SCE are eligible for second interim payments totaling $35,254,711.
Table 30: RRIM Calculator Output with Positive Interactive Effects Only
Table 31: RRIM Calculator Output with Positive and Negative Interactive Effects

Table 32: RRIM Calculator Output without Interactive Effects
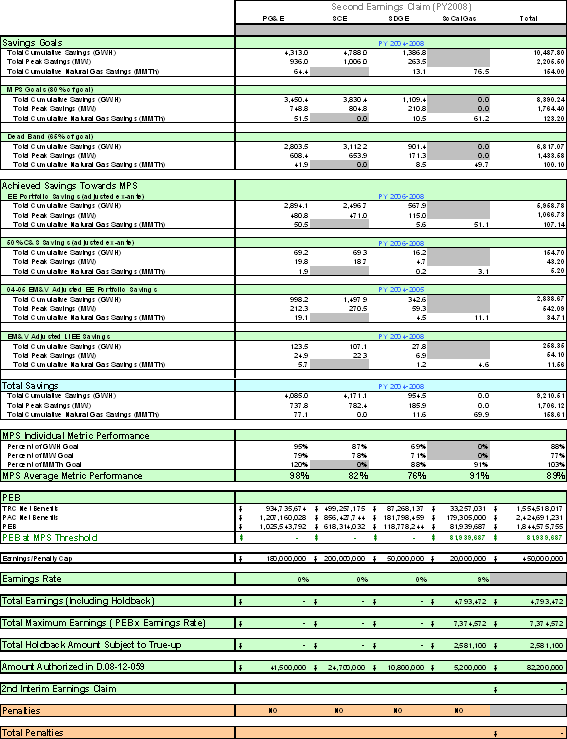
8. CHANGES MADE TO THE 1ST VERIFICATION REPORT
In response to parties' comments to Energy Division's Draft Verification Report, the following changes were made to the Final 1st Verification Report:
To address the issue of interactive effects, Energy Division's Final Verification Report presented three different sets of results: Without Interactive Effects, With Both Positive and Negative Interactive Effects, and With Positive Interactive Effects Only.
This required the creation of three sets of Interim Databases, which are used to update the UES values in the VRTs. The Interim Databases can be found in Appendix R. Additional documentation can be found in Appendix O.
In addition, the 95/5 residential/non-residential split was applied to SDGE 3016. The methodology is described below:
To reallocate savings for the residential upstream lighting program to a nonresidential sector, weighted average unit energy savings (UES) values (MW, GWh, therms) were calculated for screw-in CFL's only. The list of measures is listed in Table 33 below.
Table 33 - List of SDGE3016 Upstream Lighting Screw-in CFL Measures
235144-Screw-in CFL (<=12 watt) <800 Lumens |
235133-Screw-in CFL (13 watt) <800 Lumens |
235057-Screw-in CFL (13 watt) 800-1,099 Lumens |
235019-Screw-in CFL (14 watt) <800 Lumens |
235134-Screw-in CFL (14 watt) 800-1,099 Lumens |
235135-Screw-in CFL (15 watt) 800-1,099 Lumens |
235145-Screw-in CFL (15 watt) >=1,100-1,599 Lumens |
235061-Screw-in CFL (18 watt) >= 1,100-1,599 Lumens |
235023-Screw-in CFL (20 watt ) <1,100 Lumens |
235136-Screw-in CFL (20 watt) >=1,100 Lumens |
235063-Screw-in CFL (23 watt) <1,600 Lumens |
235126-Screw-in CFL (23 watt) >=1,600 Lumens |
235085-Screw-in CFL (25 watt) >=1,600 Lumens |
235083-Screw-in CFL (26 watt) >=1,600 Lumens |
235027-Screw-in CFL (30 watt) >=2,001 Lumens |
235052-Screw-in CFL (>39 watt) >=1,600 Lumens |
The new UES values were calculated using 95% residential savings and 5% nonresidential savings. Mathematically this is represented by the formulas below:
MW = (0.95*residential_MW)+(0.05*nonresidential_MW)
GWh = (0.95*residential_GWh)+(0.05*nonresidential_GWh)
therms = (0.95*residential_therms)+(0.05*nonresidential_therms)
Weighted average UES values were calculated for individual wattages listed in Table 33 above. The UES values for screw-in CFL's within the VRT were then updated with the newly calculated savings where the wattages matched. The fields within the VRT that were updated are listed below in Table 34.
Table 34 - List of VRT variables updated with new weighted average calculated values
EDUpdatedExAnteGrUnitSavMW |
EDUpdatedExAnteGrUnitSavGWh |
EDUpdatedExAnteGrUnitSavtherms |
EDUpdatedExAnteGrSavMW |
EDUpdatedExAnteGrSavGWh |
EDUpdatedExAnteGrSavtherms |
EDDEERExAnteGrUnitSavMW |
EDDEERExAnteGrUnitSavGWh |
EDDEERExAnteGrUnitSavtherms |
Comments/Corrections Made |
Where |
Used Interactive DEER numbers, removing any negative therm interactive effects |
Interim DB (Impact ID Table) |
Mapped all upstream CFL measures that readily mapped to DEER 06-07 measures |
Interim DB (Technology ID Table) |
Mapped PGE2000 and SDGE3028 refrigerator/freezer recycling measures |
Interim DB (Technology ID Table) |
Changed refrigerator/freezer recycling weights |
Interim DB (Impact ID Table) |
SEMPRA and PGE upstream measures received territory-weighted climate zone |
Interim DB (Climate Zone Table) |
SDGE3028 default building type received Res Single Family |
Interim DB (Building Type Table) |
Scaled up UES for the SEMPRA 40-watt base case T8's |
Interim DB (Impact ID Table) |
Mapped Medical Clinic building types to Health/Medical - Nursing Home in DEER |
Interim DB (Building Type Table) |
The VRT Contains FALSE Errors Which Incorrectly Count SCE's Benefits: Certain measure/sector combinations were not being correctly mapped to legal sector/shape combinations as determined by the E3 calculator. Our mapping table was updated to map all measures to legal sector/shape combinations. |
The change was made in a lookup table in the VRT Access database. |
The VRT Incorrectly Applies its Climate Zone Mapping to SCE: SBW was mapping the climate zone to SYSTEM, the system-wide "average" climate zone, in all cases where the zipcode mapping failed, or where the zipcode mapping produced two distinct values. The fix is to select either the predominant climate zone for the zipcode or a valid Program Tracking or E3 climate zone for the measure before defaulting to SYSTEM. This change affects SCE2517, SCG3513, SDGE3025, and SDGE3010. |
The change is in the VRT. The value is calculated in file VRT_Calculator_[program]_UES_EUL_IRate_RR_NTGR.xls |
Incorrect Mapping of DEER EUL: Some building type/lighting measure combinations were not found in our EUL lookup table, with the result that the EUL in the VRT was the EUL from either Program Tracking or the E3. The fix was to update the EUL lookup table to include all building type/measure combinations. |
The change is in the VRT. The value is calculated in file VRT_Calculator_sce2517_UES_EUL_IRate_RR_NTGR.xls |
For the SCE2517 Express Efficiency program, the annual GWh and MW savings in the VRT did not match the E3 reported values: In Program Tracking data, SCE reported savings in two ways - gross savings per measure, and gross unit savings per measure. SBW used the former in the VRT. SBW has since found that the second method matches the savings reported in the submitted E3. The fix was to change the method of calculating per measure GWh and MW savings to (unit savings * unit count) for Express Efficiency measures. The result is a 13.5% decrease in Express GWh savings, and a 4.7% increase in Express MW savings. |
The change is in the VRT. Changes were made in the Access database to calculate the savings the second way, and in the file VRT_Calculator_sce2517_UES_EUL_IRate_RR_NTGR.xls to use the new savings values. |
Incorrect rebate total in SEMPRA E3 filing for SDGE3010: We reviewed the response from Sempra concerning the rebate total for this program. They admit to a mistake in their filed E3. They assigned $640,609.30 to program-level cost that should have been included in the end user rebates. The VRT passes thru the program-level costs without modification, so our current VRT is double counting this expense. Their program tracking data for the rebate was correct, they just reclassified this portion for some reason. |
The only way we can think of to correct this would be to enter the double counting amount ($640,609.30) as an adjustment in the RRIM calculator SDGEAdj sheet. This amount (as a positive value) would be entered under both the TRC and PAC net benefits columns. |
U updated Lookup_IOU_Elec_Shape lookup table to include valid combinations that were previously missing |
VRT_4.5 |
Two new programs (SCE2547 and SCE2558) included in the IOU_E3_Cost_Q42007 and IOU_E3_Output_Q42007 tables . These only affect cost. They have no savings. |
VRT_4.5 |
Includes latest QCTest Queries |
VRT_4.5 |
New QCTest Summary query which returns values for all QCTest queries that have records |
VRT_4.5 |
New QC Verification Table tab. This includes an option to import Verification table from another VRT. All of the QC Test queries can be run from this tab, including the new QC Test Summary. |
VRT_4.5 |
Code validation check of FALSE values in the Climate Zone, Target Sector, and Measure column (column G). FALSE values in column G are tracked for each run. If FALSE values are detected for a Program, then a message box will appear to warn the user. If E3 files are saved, then the file will be flagged with a FALSExN in the filename, where N = the number of exceptions. |
VRT_4.5 |
Measures in Multi-Family Lighting program incorrectly aggregated at building level in some instances: Disaggregated multi-family lighting measures; in cases where specific install rates couldn't be determined, the weighted average install rate by measures category is applied |
PGE 2000 |
Match between E3 and Program Tracking data is approximately complete |
PGE 2000 |
An issue arose where the VRT rule used to define EDImputedExAnteGrUnit savings variables did not account for situations when the Program Tracking quantities differed from the quantity provided in the verification data (as defined by EDFilledExAnteQuantity). As a result, savings for the Appliance Recycling program were incorrect: To address this issue, we are now multiplying the EDImputed values by the EDFilled quantities, so that the EDUpdated unit savings values are corrected. Savings values for the Appliance Recycling program thus have been corrected. |
PGE 2000 |
R30 Reflector measures (non-HIM) received an installation rate of 0, due to its inclusion in the verification data: Install rate for R30 Reflector set to 1 |
PGE 2000 |
A few instances existed where incentives were being double-counted (under rebates for end use customers and under incentives to others: Instances where this was an issue were addressed and corrected |
PGE 2000 |
Double counting install rate for upstream CFL measures that were not updated via the new DEER updates: New install rate of 88 % (67%/76%) to upstream measures not receiving DEER updates |
PGE2000 |
The VRT Does Not Properly Report the Costs Associated With SCE's 2006- 2007 Claim: This was 99% due to the 95/5 reallocation of upstream CFL's - an error in SAS code led to a several thousand CFL's incentives excluded - this is not fixed |
SCE2501 |
IOU Tracking Systems Were Incorrectly Imported To VRT: This was due to the check_date missing for all of the indicated missing measures - instead the latest date falling within the 2006-2007 range and non-null date within the tracking database was used |
SCE2501 |
The VRT Incorrectly Applies the Recommended Verification Rates From The Contractor Verification Reports Into the Databases: For this question there are two issues - one is that the installation rate differs between the verification report and the VRT, and the second is that rate differs within the VRT among the same verification group. To address the second issue, the installation rate exists on a site by site basis and therefore some sites may have had 33% of the expected measure quantity installed while others had 80% or 100%. All measures that are part of the verification measure grouping that were not sampled should have an indeed did receive a consistent installation rate. To address the first question - where installation rates differed between the report and the VRT - this was due to the reexamination of the installation rate algorithms used for the original verification report and finding that revised algorithms were more appropriate and accurate measurements for some programs. |
SCE2501 |
Incorrect Mapping of DEER UES Assumptions: The latest version of the VRT resolves this issue. Since SCE's upstream CFL program accomplishments already incorporates an ISR of 90 percent, the VRT now applies an adjustment factor of 74.44 percent (67 percent / 90 percent) to the upstream CFL program accomplishments to simulate an installation rate of 67 percent for those upstream measures not updated by the interim DEER revisions. |
SCE2501 |
Incorrect Mapping of DEER NTG: All NTG errors within the SCE2501 program as reported by SCE were resolved and are now correctly applied in the latest version of the VRT database. |
SCE2501 |
Incorrect Mapping of DEER EUL: All EUL errors within the SCE2501 program as reported by SCE were resolved and are now correctly applied in the latest version of the VRT database |
SCE2501 |
Incorrect Incremental Cost Assumptions: Tracking-level costs for all four SCE2501 tracking databases were incorrectly assumed to be the incremental costs used as inputs to the SCE2501 E3 calculator. The application of E3 incremental costs at the appropriate measure level were applied to the latest versions of the SCE2501 VRT database. |
SCE2501 |
Upstream CFL for C&I program did not receive the 67% installation rate: Applied the 67% installation rate to upstream C&I CFL measures |
SCE2501 |
Corrected the NTG for SCE2511 to 0.85 because they are direct install. |
SCE2511 |
Corrected the EULs for SCE2511 by using the correct building types. |
SCE2511 |
Corrected the EULs for SDGE3020 and SDGE3012 by using the correct building types. |
SDGE3020 |
Changed PGE Upstream Screw-in Lighting from 90/10 to 95/5 and changed the install rate to .67. |
PGE2080 |
Changed EDUpdatedExAnteEndUserRebate, EDUpdatedExAnteIncentiveToOthers, EDUpdatedExAnteDirectInstallLab, EDUpdatedExAnteDirectInstallMat, and EDUpdatedExAnteGrMeaCost to be multiplied by the inverse of the install rate. |
|
For SCE2511 we used the ratio of the direct install materials to labor amount to separate the total direct install amount found in the tracking database. |
SCE2511 |
Comments Page # |
IOU |
IOU Recommended Changes |
Program |
ED Response |
19 |
SCE |
The costs associated with SCE's Emerging Technologies program (SCE2515) are included in ED's calculation of SCE's PEB. |
SCE2515 |
This will be adjusted in the future using the "adjustment" tab of the RRIM spreadsheet |
19 |
SCE |
The Aggregation of Housing Agencies program (SCE2547) and the Modernization and New Construction Program for Schools (SCE2558) are not included in the Draft Report. |
SCE2547, SCE2558 |
This was corrected in the VRT v.4.5 |
19 |
SCE |
The Draft Report does not include the costs associated with SCE's EM&V projects. |
This will be adjusted in the future using the "adjustment" tab of the RRIM spreadsheet | |
20 |
SCE |
The Draft Report incorrectly includes the achievements of SCE's Palm Desert program (SCE2566) towards the MPS in direct contradiction to CPUC policy. |
SCE2566 |
This will be adjusted in the future using the "adjustment" tab of the RRIM spreadsheet |
20 |
SCE |
The Draft Report contained an error in the formula that calculated the |
This will be corrected in the RRIM spreadsheet | |
21 |
SCE |
The Draft Report changes SCE's market sector allocation of its Upstream CFL program. |
ED applied 95/5 to all upstream lighting programs | |
23 |
SCE |
In the lighting portion of the Nonresidential Direct Installation (SCE2511) program, DEER effective useful lives, which would produce a significantly positive effect, were not updated. |
SCE2511 |
EULs were updated in the SCE2511 VRT |
23-24 |
SCE |
The following statement should be removed from the Final Report as SCE abides by the reporting requirements approved by the Commission: "It should be noted that ED believes the utilities continue to be out of compliance with the 2/21/2006 ALJ ruling...which require the utilities to report measure level data that is not aggregated in any way in their quarterly reports.18" |
The statement is a reference to the IOUs quarterly measure lists generally not being disaggregated. | |
24 |
SCE |
The Draft Report grossly errs in updating non-incremental cost values for the Upstream Lighting program. |
SCE2501 |
The application of E3 incremental costs at the appropriate measure level were applied to the latest versions of the SCE2501 VRT database. |
Comments Page # |
IOU |
IOU Recommended Changes |
Program |
ED Response |
48 |
SCE |
Interactive effects should be included only for nonresidential applications in the Final Report. |
ED presented results with positive interactive effects, interactive effects, and without interactive effects | |
63 |
SCE |
The Draft Report is incorrect in its "compromise" of a 95/5 res/nonres split. |
SCE2501 |
ED applied 95/5 to all upstream lighting programs |
64 |
SCE |
It should be pointed out that the E3 Calculator, version 4a, does not contain this error and is what SCE uses to report its savings and cost-effectiveness to the Commission. |
For the final verification report ED used version 4b, but will explore using 4a in the future | |
64 |
SCE |
The VRT used in the Draft Report incorrectly accounts for expenditures incurred in 2006-2007 by SCE. |
SCE2501, SCE2511, SCE2517 |
These variances were fixed; however, some were due to rounding errors. |
65 |
SCE |
SCE's Residential Energy Efficiency Incentive program (SCE2501) there were 174,798 units missing from the VRT (Upstream Lighting was missing 96.019 units; Single Family rebates had a discrepancy of 78,779 units; Lightwise had 8,911 units that appear to be inadvertently lumped together with Upstream Lighting. |
SCE2501 |
This was corrected in the SCE 2501 VRT |
66 |
SCE |
Express Efficiency (SCE2517) had 44 units missing |
SCE2517 |
No changes were made since ED did not find the discrepancies that SCE pointed out. |
66-67 |
SCE |
24 of the 38 measures have a verification rate discrepancy |
SCE2501, SCE2511, SCE2517 |
This inconsistency was due to the reexamination of the installation rate algorithms used for the original verification report and finding that revised algorithms were more appropriate and accurate measurements for some programs. |
68 |
SCE |
17 of SCE's measures have a "False statement" in the E3 calculation |
This is fixed in VRT v.4.5: Certain measure/sector combinations were not being correctly mapped to legal sector/shape combinations as determined by the E3 calculator. Our mapping table was updated to map all measures to legal sector/shape combinations. | |
Comments Page # |
IOU |
IOU Recommended Changes |
Program |
ED Response |
69 |
SCE |
There are 20 cases where the VRT zip code was inappropriately mapped to "system" when it should have been mapped to climate zone 5. |
This was fixed in the program-specific VRT by selecting either the predominant climate zone for the zipcode or a valid Program Tracking or E3 climate zone for the measure before defaulting to SYSTEM. | |
70 |
SCE |
ED did not include 2004-2005 IDEEA programs that would have achieved over 37 million GWh and 5 MW. |
This was corrected in the final report. | |
70 |
SCE |
ED did not include five Summer Initiative programs that would have achieved over 178 million GWh and 48 MW. |
This was corrected in the final report. | |
73 |
SCE |
For ED to obtain the final results from programs that did not receive an impact evaluation, the results from the 2006 EE Annual Report need to be used. This error miscalculated SCE's program impacts by nearly 47 million GWh and nearly 4 MW. |
ED used the 2006 Annual Reports with some exceptions. Please see revised section 5 of final report on 2004-05 data. | |
73 |
SCE |
SCE's California New Homes Program and Savings By Design programs paid after 2005 appear not to be included in the Draft Report. |
No changes were made. Please see revised section 5 of final report on 2004-05 data. | |
77 |
SCE |
The following list of programs verified installation rate need to be revisited to ensure that any installation rate calculation does not include early removals and breakage of installed measures: |
|
ED did not address this recommendation at this time. |
79 |
SCE |
The installation rate should thus include bulbs that have burned out or been removed. |
|
ED did not address this recommendation at this time. |
87 |
SCE |
Medical Clinic building type should have been mapped to a more similar Nursing Home building type contained in DEER 2008 |
SCE2511, SCE2517 |
This was corrected in the Interim DB |
87 |
SCE |
The Draft Report incorrectly applied an installation rate twice on CFL measures that were "passed though." This error occurred with CFLs found in SCE's Upstream Lighting (SCE2501) program that were purposely not mapped to DEER 2008. |
SCE2501 |
New install rate of 88 % (67%/76%) applied to upstream measures not receiving DEER updates in PGE2000 VRT |
Comments Page # |
IOU |
IOU Recommended Changes |
Program |
ED Response |
88 |
SCE |
There are two different ED-updated ex ante gross unit savings values shown for the same lamp. In the VRT database, the 204.65 GWh value is designated for a 20 watt CFL along with a value of 221.83 GWh for the same CFL. |
This was corrected in the Interim DB | |
88 |
SCE |
There are two different ED-updated ex ante gross unit savings values shown for the same measure: the linear fluorescent update received a value of 755.905 GWh in some cases and 789.072 GWh in other cases. |
SCE2517 |
This was corrected in the Interim DB |
88 |
SCE |
The appliance recycling program was mapped incorrectly to DEER 2008. |
SCE2500 |
ED did not address this recommendation at this time. |
89 |
SCE |
ED's 79% realization rate was incorrectly applied in some cases as the final measure values in the VRT are substantially less than 79% of the ex ante value. Furthermore it is unclear if a double |
SCE2517 |
No change made. There is no double realization rate adjustment. 79% was applied properly in SCE2517 VRT. |
90 |
SCE |
Incorrect mapping of DEER NTG: Specialty CFLs should be 85% not 60% |
SCE2501 (Upstream Lighting) |
All NTG errors are now correctly applied in the SCE2501 VRT |
90 |
SCE |
Incorrect mapping of DEER NTG: Screw-In CFLs should be 80% not 60% |
SCE2501 (lightwise) |
All NTG errors are now correctly applied in the SCE2501 VRT |
90 |
SCE |
Incorrect mapping of DEER NTG: CFL fixtures should be 85% not 80% |
SCE2501 (Staple) |
All NTG errors are now correctly applied in the SCE2501 VRT |
90 |
SCE |
Incorrect mapping of DEER NTG: Occupancy Sensors should be 84% not 77% |
SCE2517 |
No change made. Occupancy sensor NTG should be 77% |
90 |
SCE |
Incorrect mapping of DEER NTG: All direct install refrigeration should be 85% not 46-80% |
SCE2511 |
Corrected the NTG to 0.85 in the SCE2511 VRT |
90 |
SCE |
the EULs for the Nonresidential Direct Installation (SCE2511) program were not updated |
SCE2511 |
Corrected the EULs by using the correct building types in the SCE2511 VRT |
91 |
SCE |
Incorrect EUL: LED night light should be 16 not 8 |
SCE2501 (Staple) |
All EUL errors are now correctly applied in the SCE2501 VRT |
91 |
SCE |
Incorrect EUL: Torchiere should be 16 not 9 |
SCE2501 (Staple) |
All EUL errors are now correctly applied in the SCE2501 VRT |
Comments Page # |
IOU |
IOU Recommended Changes |
Program |
ED Response |
91 |
SCE |
Incorrect EUL: Linear Fluorescents DEER 2008 EUL formula not applied in all cases |
SCE2517 |
The EUL lookup table in the SCE2517 VRT was fixed to include all building type/measure combinations. |
91 |
SCE |
Draft Report made a significant error by updating the incremental costs in the Upstream Lighting (SCE2501) program. |
SCE2501 (Upstream Lighting) |
The application of E3 incremental costs at the appropriate measure level were applied to the latest versions of the SCE2501 VRT database. |
9 |
Sempra |
SDG&E and SoCalGas final core utility program 2004-2005 results are reported in their respective 2006 Annual Report |
ED was not able to use SDG&E and SoCalGas 2006 Annual Reports because the data were not provided in a disaggregated format. Please see revised section 5 of final report on 2004-05 data | |
9 |
Sempra |
There are many instances where customers still have T12 F40 lamps and this was ignored in the update to use DEER |
SDGE3020, SDGE3012 |
The new Interim DB has scaled up UES for the SEMPRA 40-watt base case T8's |
10 |
Sempra |
SDG&E believes that the final split between residential and nonresidential for the upstream lighting should be applied consistently |
SDGE3016 |
ED applied 95/5 to all upstream lighting programs |
10 |
Sempra |
SDG&E believes that the savings and NTG should be included in the final Verification Report as SDG&E provided in the E3 calculator. SPC realization should not be applied to Energy Savings Bid projects. |
SDGE3020 |
No change was made because ED believes that the proper realization rates were applied to the Bid projects. |
10 |
Sempra |
SDG&E and SoCalGas however do not agree with the magnitude of the heating and cooling impact that the DEER Team estimates for CFLs in residential homes |
This is a DEER issue and cannot be addressed in this report | |
4 |
PGE |
Interactive effects should not be considered at least until the commission revisits the energy-saving goals |
ED presented results with positive interactive effects, interactive effects, and without interactive effects | |
7 |
PGE |
PG&E recommends that the CPUC return to the ex ante in-service rates until additional data is presented addressing the too-soon-after-purchase customer data. |
PGE2000 |
No changes were made. |
8 |
PGE |
The PGE Industrial verification report includes net-to-gross data from various years for the Savings by Design program that has been averaged but not weighted. This is mathematically incorrect. |
PGE2004 |
The VRT calculation just took the DEER values. ED may consider this recommendation in future DEER updates. |
9 |
PGE |
There is no convincing evidence to change the existing 90/10 split and it should be left "as is" until studies are finalized. |
PGE2000, PGE2080 |
ED applied 95/5 to all upstream lighting programs |
Comments Page # |
IOU |
IOU Recommended Changes |
Program |
ED Response |
9 |
PGE |
The 2005 savings values from the 2005 LIEE Annual Report should be used. This correction results in 5.34 MW, 25 GWh, and 1.11 MM therms for 2005. |
No changes were made. | |
10 |
PGE |
The draft verification report employs incorrect data for the 2004-2005 period savings. This correction results in 357MW, 1,741GWh, and 45MM therms for that period. |
ED used the 2006 Annual Reports with some exceptions. Please see revised section 5 of final report on 2004-05 data. | |
10 |
PGE |
For residential refrigerator recycling and residential ceiling insulation, the measure name, measure unit, and climate zone are all the same, yet the database adjusts the same measure by varying percentages for the unit energy savings. |
PGE2000 |
The residential refrigerator recycling UES values were updated in the Interim DB. |
10 |
PGE |
Since PG&E's upstream CFL program accomplishments already incorporates an ISR of 76 percent, the VRT should have applied an adjustment factor of 88 percent (67 percent / 76 percent) to the upstream CFL program accomplishments to simulate an installation rate of 67 percent. |
PGE2000 |
This rate was applied to the PGE2000 VRT |
10 |
PGE |
In order to account for the correct energy savings from the 2004- 2005 program accomplishments, the energy savings from the commitments paid after 2005 for the RNC and SBD programs need to be included in the final verification report. |
No changes were made. Please see revised section 5 of final report on 2004-05 data. |
# |
Party |
Comment Summary |
Response |
1 |
SCE |
Application of the DEER Updates Not Based on Ex Post Studies and Is Inconsistent with the Adopted Protocols |
Energy Division's decision to update ex-ante parameters with values found in DEER is pursuant to D. 08-01-042, OP 3(b). See pages 14 to 16 of that decision for the discussion, "For measures included in the Database for Energy Efficient Resources (DEER), however, we will update the values contained in the E3 calculators with the 2008 and 2009 DEER updates of ex ante measure savings parameters, including net-to-gross ratios and expected useful lives". |
2 |
SCE |
Application of the DEER Expected Useful Lives - A Metric Not Subject To True-Up by Ex Post Measurement Studies - Is Inconsistent With the Adopted Protocols |
Energy Division's decision to update ex-ante EULs with EUL values found in DEER is pursuant to D. 08-01-042, OP 3(b). See pages 14 to 16 of that decision for the discussion, "For measures included in the Database for Energy Efficient Resources (DEER), however, we will update the values contained in the E3 calculators with the 2008 and 2009 DEER updates of ex ante measure savings parameters, including net-to-gross ratios and expected useful lives. [emphasis added] " |
3 |
SCE |
The Verification Report Goes Well Beyond the Protocols |
Energy Division is implementing Commission Decisions 07-09-043 and 08-01-042 in preparing the verification report. In response to the comment, "There is no reason for a pre-calculation of earnings to be performed in a report which is supposed to be focused on unit counts and costs." See "Note" at bottom of Attachment 6 of D.07-09-043, "Interim claims are based only on the verification reports." This is precisely why the advice letter filing come after the issuance of ED's verification report and not before. |
4 |
SCE |
Future Evaluation, Measurement, and Verification Reports Must be Timely |
In response to the comment, "The adopted protocols allowed for the flexibility of reports, such that not every program may receive a report each year." ED has exercised this flexibility in only selecting the top 21 programs to receive a verification study. However, ED agrees that future EM&V reports and the utility data required by ED to produce the EM&V reports should be timely. |
5 |
SCE |
The Energy Division Made Significant Errors that Bring Question to the Integrity of the Draft Report |
The errors SCE identified errors are corrected in the final version issued on 1/15/09. Part of the purpose of the draft verification report was to allow stakeholders to identify errors. Attachment 7 of D.07-09-043 indicates, "Stakeholders have an opportunity to provide written comments to Energy Division identifying any errors in the draft Verification Report". |
6 |
SCE |
Energy Division is Over-Stepping the Direction Provided by the CPUC |
see response to specific comments below |
7 |
SCE |
Draft Report Reverses CPUC Direction on Cumulative Savings for 2006-07 Interim Claims |
ED's decision to factor in savings from 2004 is pursuant to D. 07-09-043, OP 4 (b), which states, "Interim claims shall be evaluated on a "Cumulative-to-Date" basis, which counts the verified achievements from program year(s) in determining whether the MPS is met in each subsequent interim claim." See page 120 of that decision for a discussion of a "Cumulative-Program-Cycle-Basis" which is what SCE argues for in this comment, and which was rejected in the decision. |
8 |
SCE |
The CPUC-Approved Methodology to Calculate Energy Savings and Performance Earnings Basis is the E3 Calculator, Not the VRT |
Energy savings calculations are not done within the VRT. All energy savings calculations are done within the E3 Calculator. The VRT is simply a tool that facilitates and automates the running of the E3 Calculator. The results of the E3 Calculator runs are saved in the VRT database. The E3 files can also be saved. This allows for a transparent and verifiable way to ensure that what is saved in the database matches the E3 files. Once results are saved in the VRT database, they can be aggregated, or rolled-up, for Program or IOU. The results can also be compared to the claimed values. |
9 |
SCE |
Energy Division Incorrectly Recommends Changes to Commission Policy Regarding the Discount Rate (Weighted Average Cost of Capital) |
Energy Division continues to use 7.49% in the final verification report. |
10 |
SCE |
ED Is Bypassing EM&V Protocols in the Draft Report |
The issues that SCE raises in this comment and the specific examples provided are components of verifying the proper installation of measures. Some telephone surveys were implemented as part of the installation verification work, which were supplemented with a sample of on-site surveys. The EM&V protocols give ED a significant amount of discretion. See page 1 in the Introductory section of the California Energy Efficiency Protocols, which states: The "Protocols are the primary evaluation guidance documents for all types of evaluations presented in these Protocols, however this is not to be construed as limiting the ability of the CPUC or the Joint Staff to evaluate items in addition to or beyond those identified |
11 |
SCE |
ED Incorrectly Calculates the Performance Earnings Basis |
These details were corrected in the final |
12 |
SCE |
ED Incorrectly Calculates the Minimum Performance Standard |
These details were corrected in the final |
13 |
SCE |
Draft Report Incorrectly Calculated Earnings/Penalty Amounts |
These details were corrected in the final |
14 |
SCE |
ED Arbitrarily Determines What To and Not To Include in the Draft Report |
The market sector allocation of Upstream CFLs is not arbitrary or opinion based, as documented in the verification report. Interactive effects are included in the final report. |
15 |
SCE |
Clear CPUC Policy on Nonresidential Interactive Effects |
We have run two additional scenarios in the final report. One has only "positive" interactive effects and one has both "positive" and "negative" interactive effects. |
16 |
SCE |
Draft Report Focuses on High Impact Measures That Were Negatively Affected by DEER 2008 and Does Not Address Measures That Were Positively Affected by DEER 2008 |
This comment suggests the Energy Division intentionally rigged the results to prevent SCE from obtaining its goals. The focus on high impact measures for both the verification report and DEER updates are based on the significance of those measures to the total portfolio savings, not based on the direction and magnitude of the changes made by DEER. |
17 |
SCE |
ED Makes Errors in their Assertions of SCE Non-Compliance |
The footnote which makes this statement is referring to the utilities in general, not specifically to SCE. |
18 |
SCE |
Lack of Transparency in Draft Report Hampers IOU Review |
ED makes ever effort to provide all the documentation to stakeholders and write the narrative of the report to be consistent with the analysis and data provided in the appendices. |
19 |
SCE |
CPUC Goals and Earnings Estimates Were Based Upon Current IOU Ex-Ante Estimates |
SCE indicates that they believe that the goals were set on a different set of ex ante assumptions than the recent DEER updates and that thus performance should be measured relative to goals using the previous ex ante data. The decision to update the ex ante assumptions based on the latest DEER was made by the CPUC in the first PTM decision. ED's charge in this report is to implement that decision and apply the updates from DEER. The issue of whether greater consistency is needed or should be sought between key factors underlying the original goals analyses (e.g., imbedded net-to-gross savings ratios) and the current DEER estimates is a policy issue that falls outside the scope of the ED report. |
20 |
SCE |
DEER Updates (Partially) Finalized in Late October 2008 |
The comments about DEER 2008 having not updated measure costs are incorrect and not relevant. ED has chosen not to update, but rather to retain, the ex ante measure costs as claimed by the IOUs for the first verification report, and therefore published no measures cost values it intended to use for an ex ante update. The IOUs were directed to use DEER measure costs for deemed measures and actual costs for customized or direct installed measures. DEER 2008 measure costs were updated for many measures and DEER 2005 values were retained for others; ED has assumed that the IOUs followed the CPUC direction to use the most up-to-date DEER values or actual values and chose not to change any IOU claimed measure cost values. It is true that there were limited new EM&V results or data available for use in the DEER 2008 update or the ED ex ante update. The two sources of such data are the 2004-2005 EM&V studies and the 2006-2008 studies. The 2004-2005 studies were contracted by the IOUs and the IOU have received the preliminary results of those studies while they were being developed. Except for NTG values for SPC and Express Efficiency, the DEER team did not see those results until their final results were published and long after the IOU had reviewed the values. Although the ED interim reports were eliminated the IOUs have had ongoing access to 2004-2005 results which could have been used to update their savings claims well ahead of the ED ex ante update using the same or similar values. In fact, the IOU have been constantly updating their ex ante values but chose not to use some 04-05 results. The IOU were directed by several rulings to update their planning values with recent results, particularly for NTGs, but chose not to do so while continuing to use values that are known to be overly optimistic. SCE complains that doing the updates now, which they were requested to do before the cycle started, is unfair. |
21 |
SCE |
DEER 2008 for 2006-07 Is incomplete |
As stated above, the comments about DEER 2008 having not updated measure costs are incorrect and not relevant. ED has chosen not to update, but rather to retain, the ex ante measure costs as claimed by the IOUs for the first verification report. In this comment it is implied that ED should have updated DEER 2008 in December after new results were available. In other comments it was suggested that ED updates DEER too often, and in yet other comments it is suggested that there should be no such updates and the values should be left at those developed by the IOUs for their 2006-2008 planning. |
22 |
SCE |
ED Did Not Implement A Proper Vetting Process that Facilitates Valued IOU Input |
The DEER team managed by Energy Division completed a vetting process consistent with the process protocols adopted by the Jan. 11, 2006 (R. 01-08-028) and Jan. 2, 2007 (R. 06-04-010) ALJ rulings. The ED vetting process consisted of posting draft DEER values for stakeholders to review and provide written comments. Webinars and follow-on meetings offered opportunities for stakeholders and DEER Team to ask clarifying questions of each other and to further discuss in greater detail stakeholder comments. The DEER Team posted responses to these written comments. The details of the comments and responses are in Appendix Q (attached to the final verification report). ED did consider each comment provided by stakeholders. In cases that warranted, the DEER Team did make a revision per comments. However, in cases where a comment or supporting information was not appropriate, the comment did not result in a change in the DEER value. |
23 |
SCE |
IOUs Have Significant Issues With the Quality of DEER 2008 Updates |
Many improvements envisioned in the DEER 2005 report were implemented in DEER 2008. Improvement included for example, more use of EM&V results and improved calibrations, with the addition of behavioral information into the calibration process. Although many of the initial updates contained in DEER 2008 are simulation or model based, ED does not envision that future updates will always be simulation based. The DEER 2008 update focused on non-res and commercial building measures that were the highest savings contributors to IOUs' portfolios. As additional measure are updated and added to future versions of DEER, methods other than building simulations will be utilized. |
|
|
DEER Updates Not Necessarily Based Upon EM&V, As Requested in D.08-01-042 |
In D.05-01-055 Section 5.3.2, the Commission placed DEER under the management of Energy Division under Research and Analysis in Support of Policy Oversight. "In performing the Research and Analysis functions, Commission and CEC staff should have full flexibility to obtain input from various resources (P. 122)." The DEER Update were based EM&V findings as described on Page 16 in D.08-01-042. However, the Decision did not restrict the resources that DEER might use. In cases where measure information from these latest evaluations were not available, not conclusive, or questionable, DEER also incorporated the latest information available from other resources to either support or reject EM&V findings. |
24 |
SCE |
Lack of Technical Transparency in Draft Report |
ED created the VRT to be transparent, so a reviewer would be able to look at the "verification table" in the VRT and see which values were updated. The VRT also has QC queries built in, so the user and easily compare results. With respect to the "additional documentation available upon request," ED will make sure that in the future, these files are provided all at once with the report deliverable. |
25 |
SCE |
Lack of sufficient documentation |
This comment is related to the DEER documentation. The team assigned to complete the verification report was tasked with using the numbers from DEER, and thus, had no direct input on the DEER methodology and results. |
26 |
SCE |
SCE has asked for information that has still not been received |
This comment is related to information requested of the DEER team and is outside the scope of the ED VR tasks. |
27 |
SCE |
ED implemented unproven assumptions in the draft report |
SCE's comments argue that 90/10 is the minimum split between residential and non-residential for ULP. ED's DVR, Section 6.5.6, makes the argument that this assumption cannot be validated, but that the evidence cited leans in favor of the 10% assumption actually being lower. ED plans on implementing a study as part of its 2010 report that will calculate a better estimate of the ULP res/non-res split, but until then, ED believes 95/5 is a more appropriate assumption, since 90/10 cannot be seen as a reliable estimate at this time. |
28 |
SCE |
The VRT is systematically and Technically Flawed |
see below |
29 |
SCE |
The VRT Uses the Incorrect Version of the E3 Calculator |
The VRT development team was directed by Energy Division to use the E3 files available from
http://www.ethree.com/cpuc_cee_tools.html, under the heading "E3 Calculators in Compliance with Decision 07-09-043. |
30 |
SCE |
The VRT Does Not Properly Report the Costs Associated With SCE's 2006- 2007 Claim |
For the Draft Report, the SCE2501 VRT ED updated total expenditures were $67,723,294 - compared to $67,724,174 - a difference of less than .002%. The final release of the VRT for SCE2501 will reflect these new values. For SCE2517, the $114 variance is believed to be a rounding error (<< .01%). |
31 |
SCE |
IOU Tracking Systems Were Incorrectly Imported To VRT |
The draft VRT for SCE2501 had excluded measure counts due to the lack of a "check_date" which was assumed to indicate that the measure had been paid. All versions since then have included all records from the tracking database using a logic that uses a different date field that is fully populated - for approximately 30 records with no date information, the "install_date" field was used as a proxy date field. |
32 |
SCE |
The VRT Incorrectly Applies the Recommended Verification Rates From The Contractor Verification Reports Into the Databases |
For the residential programs, installation rates exists on a site by site basis and therefore some sites may have had 33% of the expected measure quantity installed while others had 80% or 100%. All measures that are part of the verification measure grouping that were not sampled received a consistent installation rate. |
33 |
SCE |
The VRT Contains FALSE Errors Which Incorrectly Count SCE's Benefits |
In the Draft Report, the VRT for SCE2517 contained 17 measures with "False errors". This was due to an incorrect interpretation of what Measure End Use Shapes were allowed in the SCE E3 Calculator. The lookup table of these values has now been corrected. All "False" values have been eliminated in SCE2517. |
34 |
SCE |
The VRT Incorrectly Applies its Climate Zone Mapping to SCE |
The code that converts Zip code to Climate Zone will be corrected for the next release. |
35 |
SCE |
ED Omitted Program Savings From 2004-05 and Incorrectly Calculated the Proposed Ex-Post Savings of Others |
The IDEEA program savings were not included in the DVR; the evaluation report was overlooked. SCE provided the ex-post results for each program and ex-ante for 80Plus which did not receive an impact evaluation; These savings have been incorporated into the 04-05 impact spreadsheet. |
36 |
SCE |
ED Omitted Program Savings From 2004-05 and Incorrectly Calculated the Proposed Ex-Post Savings of Others SEE EMBEDDED FILE |
SCE provided an expanded table 2.2 from the annual report to account for the summer initiative savings, which typically were not included in the evaluations, but the savings should be included in the final VRT. The approach used to discount savings for SPC will be reviewed; The summer initiative savings for SFEER will be included; The Small Business Lighting Campaign did not have an evaluation, so the ex-ante reported savings will also be included. |
37 |
SCE |
Programs Missing Impact Evaluations: Application of Realization Rates |
SCE provided an expanded table 2.2 from the annual report to provide the savings for the missing impact evaluations: Multi-Family, CA ENERGY STAR, Bakersfield, and Small Non-res HTR. The Single Family Rebate program results will need to be further explored before included the ex-post results in the Final ED Verification Report. |
38 |
SCE |
2004-2005 Impact Evaluations Did Not Properly Account For Commitments That Are To Be Included In the 2004-2005 Recorded Results |
The wording in the Draft Report on table 9 suggests that commitments were included for all, but this is not necessarily the case. In the Final Verification Report, the language around table 9 will be re-worded, but there will likely be no change in the savings amounts. ED made the following changes to the final verification report for all IOU numbers except for SDG&E who did not respond to the ED data request on this issue: The IOU Annual Reports were used for the residential new construction programs. The IOU Annual Reports were use for the non-residential new construction programs, with the gross realization rates from the 2004-2005 evaluation report applied to the commitments. |
39 |
SCE |
ED's Draft Report Is Outside the Guidelines Approved in the EM&V Protocols |
The EM&V protocols give ED a significant amount of discretion. See page 1 one the Introductory section of the protocols, which states: The "Protocols are the primary evaluation guidance documents for all types of evaluations presented in these Protocols, however this is not to be construed as limiting the ability of the CPUC or the Joint Staff to evaluate items in addition to or beyond those identified |
40 |
SCE |
The Verification Approach Utilized is Flawed |
Decision 08-01-042 requires the use of updated DEER parameters in addition to installation rates. The referenced guidance document was given to evaluation contractors to guide their work prior to the issuance of D.08-01-042. Energy Division believes the methodological examples provided by SCE were an appropriate part of verifying measure installations. |
41 |
SCE |
The Installation Rates Determined By the Draft Report Are Incorrect |
The Energy Division management responsibilities do not end with the issuance of the guidance document cited by SCE. Energy Division has the discretion to make changes to the EM&V work as needed. Point of Clarification to SCE's statement on pages 77-78: The Residential contractor did use a nested phone/onsite approach to verify that respondents' phone self-reports on the total number of CFLs installed/stored matched what was found onsite. And although the 67% installation rate technically was not verified onsite using a nested sample approach, the self-reports about total CFLs installed/stored were verified via onsite inspections. This should be considered as evidence confirming the validity of the 67% installation rate derived only from self-reports. The Major Commercial contractor scope included verification that a sampled measure was "eligible, installed and operational". The operational aspect of the scope was a confirmation that installed measures were still producing energy savings at some level. Partial credit for measures that were operational but underperforming was not allowed. Measures that were installed but no longer producing savings (e.g., broken) lowered the verification rate. |
42 |
SCE |
Incorrect Verification Reports for Upstream Programs |
SCE makes three points: (1) the ED did not give SCE proper credit for 04-05 bulbs, (2) in 06-08, SCE is getting hit twice for bulbs that break/burn out early, and (3) SCE wants credit for 06-08 bulbs that haven't been installed yet. |
43 |
SCE |
Flawed Sample Design |
The comments will be considered in the next round of verifications. |
44 |
SCE |
Insufficient Sample Size |
For ARP, the Residential contractor proposed a sample of 70 (in order to meet 90/10 using absolute precision) for each of the three program measures (recycled refrigerators, recycled freezers and recycled room air conditioners) for each utility. The sample sizes were decreased for both recycled freezers and recycled room air conditioners due to their limited participation in the program (13.8% and 0.02% of SCE's total ARP energy savings, respectively, through Q4 2007). The survey quota for recycled room air conditioners was eliminated completely while the quota for recycled freezers was lowered to 30 for each utility. This value provided 90/10 at the recycled freezers across the three IOUs. In any case, the 90/10 requirement would have applied to appliances overall not to a specific appliance. |
45 |
SCE |
Lack Of Sample Precision: SCE2501 Residential Incentive Program |
While the verification percentages include both failures (through early removals) and situations where the measure was never installed, the decision to incorporate all incented measures in the denominator for the verification rate was a choice made by the ED. This decision was made in concern over whether or not the EUL values consistently included early removals in the analysis. This issue will be re-examined as part of the evaluation studies, and if the findings show that the EULs properly accounts for early removals/failures, then those measures that are installed but removed will be added back into the numerator. The sample was a random sample of participant sites designed to provide 90% confidence and 10% precision for the verification results. The sample was based on the number of participant sites or multifamily complexes. Once a complex agreed to be in the verification survey, the on-site team attempted to census survey the common area measures. For measures installed in the individual apartment units, the sub-sampling method required surveyors to attempt to enter 10 apartments for all larger apartment complexes. The ability to achieve this target was a function of the site level management and the tenants. |
46 |
SCE |
Lack Of Sample Precision: SCE2502 Multifamily Energy Efficiency Rebates |
The sample was a random sample of participant sites designed to provide 90% confidence and 10% precision for the verification results. The sample was based on the number of participant sites or multifamily complexes. Once a complex agreed to be in the verification survey, the on-site team attempted to census survey the common area measures. For measures installed in the individual apartment units, the sub-sampling method required surveyors to attempt to enter 10 apartments for all larger apartment complexes. The ability to achieve this target was a function of the site level management and the tenants. |
47 |
SCE |
Lack Of Sample Precision: SCE2502 Comprehensive Manufactured/Mobile Home Program |
The first issue raised in the comments is a question regarding the telephone survey sample sizes: 90 for Duct Test and Seal and 150 for Refrigerant Charge and Airflow (RCA). The ED identified these measures together as the high impact HVAC Measure Group and the total is regarded as the critical number rather than the specific count of each measure. For the HVAC Measure Group then, the target was set at 200 telephone surveys in the evaluation plan. This number was thought to provide an adequate base from which to recruit the required 75 site visit participants. The Residential contractor was not able to complete the site visits from this group as planned. The site visit number was intended to provide 90% confidence with 10% precision for the HVAC measure group (and other measures installed by the comprehensive program). |
48 |
SCE |
Lack Of Sample Precision: SCE2511 Nonresidential Direct Install Program |
The comments will be considered in the next round of verifications. |
49 |
SCE |
Lack Of Sample Precision: SCE2517 Major Commercial Program |
(Paragraph 1) An earlier version of the Major Commercial verification report was submitted in the appendix of ED's Draft Verification Report. In the most recent version, the adjustment for clerical errors was removed. Therefore, SCE's comment about a "tracking system correction" is no longer relevant. (Paragraph 1, 2nd sentence.) There are three components to SCE2517: the Audit, SPC and Express Efficiency. The Audit component was not sampled nor subjected to any verification and its ex ante values were simply passed through. The sample frame for verification consisted of measures within the SPC and Express Efficiency components. A sample, stratified by savings, was randomly drawn from this frame. (2nd Paragraph) There was no cluster sampling. The population of measures was stratified by savings. Within each stratum a random sample was selected. On-site verification of sampled measures was then conducted. During on-site verification, if other program measures that were not sampled were observed, they were ignored. (3rd Paragraph, Sentence #1,2) Precision targets were never set for the Verification Study. There was no sampling within large facilities. (3rd Paragraph, Sentence #3) Lamp burnout is an issue currently under review by ED. |
50 |
SCE |
Lack Of Transparency In Verification Reports |
SCE's comments reference the Codes and Standards and New Construction report, and New Construction programs and measures. Since the scope of ED's VR was focused on the programs with the biggest savings and measures with the biggest savings in those programs, the New Construction programs that SCE mentions would not be considered a big saver compared to SCE's direct install program. With respect to an overall lack of transparency, the VRT was designed with transparency in mind, which is why the "Verification Table" includes all original values as well as any changes made by ED. |
51 |
SCE |
Incorrect Mapping of DEER UES Assumptions |
The latest version of the VRT resolves this issue for the Residential measures. Since SCE's upstream CFL program accomplishments already incorporates an in-service rate of 90 percent, the VRT now applies an adjustment factor of 74.44 percent (67 percent / 90 percent) to the upstream CFL program accomplishments to simulate an installation rate of 67 percent for those upstream measures not updated by the interim DEER revisions. For Major Commercial measures, the contractor did not make any changes to the UES values assigned in the Interim Database. The table of variances in Example 5 on page 89 is in all cases explained by the install rate. The one exception is "Industrial Indoor Lighting System Replacement." SCE would need to provide additional explanation to determine how SCE derived this large variance. SCE's realization rate (0.89) was not applied, thus there is no double counting when we apply the .79 realization rate deemed appropriate by the ED for all SPC-like programs. With respect to the Interim Database, the following corrections/clarifications are made: (Example 1 page 87) All Medical Offices will be reassigned to Health/Medical - Nursing Home instead of Small Office; (Example 3 page 88) New DEER mapping shows consistent value of 243.946. New DEER Mapping shows consistent value of 755.912. (Example 4 page 88) Refrigerator/Freezer recycling UES data revised. |
52 |
SCE |
Incorrect Mapping of DEER NTG |
All NTG errors within the SCE2501 program as reported by SCE were resolved and are now correctly applied in the latest version of the VRT database. For SCE2517, the Major Commercial contractor believes 77% NTGR for occupancy sensors is correct. For SCE 2511 the direct install refrigeration NTGR was updated to 85%. |
53 |
SCE |
Incorrect Mapping of DEER EUL |
All EUL errors within the SCE2501 program as reported by SCE were resolved and are now correctly applied in the latest version of the VRT database. The Major Commercial contractor discovered several building types were not correctly mapped, resulting in the E3 EUL being applied rather than the new DEER value. These errors will be corrected in the next VRT release. The Small Commercial contractor also corrected the EULs |
54 |
SCE |
Incorrect Incremental Cost Assumptions |
Tracking-level costs for all four SCE2501 tracking databases were incorrectly assumed to be the incremental costs used as inputs to the SCE2501 E3 calculator. The application of E3 incremental costs at the appropriate measure level were applied to the latest versions of the SCE2501 VRT database. |
55 |
SDGE |
DEER Updates Should be Publicly Vetted and Approved Before Actual Implementation |
Energy Division's decision to update ex-ante parameters with values found in DEER is pursuant to D. 08-01-042, OP 3(b). See pages 14 to 16 of that decision for the discussion, "For measures included in the Database for Energy Efficient Resources (DEER), however, we will update the values contained in the E3 calculators with the 2008 and 2009 DEER updates of ex ante measure savings parameters, including net-to-gross ratios and expected useful lives". |
56 |
SDGE |
Net-to-Gross Ration Estimation Procedures Do Not Provide Reliable Results |
The current CPUC policy governing IOU earnings claims require that earnings be based on net energy and demand impacts. Sempra's comments are policy issues outside the scope of ED's verification report. |
57 |
SDGE |
An Updated Draft Verification Report Should be Released for Comment Prior to Finalizing. The Commission Should Then Formally Adopt the Report Through a Formal Proceeding. |
Per Decision 08-12-059, ED's final verification report will be issued by resolution with "detailed information regarding the underlying assumptions relied upon as well as supporting information and documentation that provides the basis for those assumptions." |
58 |
|
DVR should be Based on SDG&E and SoCalGas 2006 Annual Report and Not EEGA for 2004-2005 Energy Efficiency Programs. |
ED made an effort to use SDG&E's Annual Report for the 04-05 programs but have not yet received the disaggregated annual report data from SDG&E for three of the programs. |
59 |
SDGE |
T-8 Baseline Does Not Reflect Actual Customer Replacements. |
DEER 34 watt lamp baselines were incorrectly applied to 40 watt lamp claims; this will be corrected in the final report by scaling up the DEER 34 watt baseline values to appropriately represent the 40 watt lamp baseline. However, SDG&E provides no confirmation of either the baseline or installed equipment ballast performance and assumes a worst case standard magnetic ballast baseline and best case ballast (low BF electric ballast) measure equipment for all claims. |
60 |
SDGE |
Update to Commercial Savings for Programs 3020 and 2013 Is Not Reasonable. |
The SDG&E Small Business Super Saver (3020) and Express Efficiency (3012) savings claims are primarily based upon per-lamp removal and/or replacement wattage changes multiplied by hours of use and peak diversity factor assumptions. Although the savings claims are based on a generic base line lamp, the savings claims are not properly supported by pre-/post-retrofit ballast information nor are they based upon specific variations in retrofit lamp wattages (for replaced lamps). Additionally, site specific metered annual hours of use are not applied to each claim; instead program average "self-report" (by whom SDG&E does not say) hours of use averages are applied using an undocumented method for developing peak demand use levels from annual hours of use. The DEER typical hours of use are based upon T8 lighting retrofit metering results updated using the annual values and hourly profiles taken directly from the 2004-2005 Express Efficiency data. ED believes these DEER values to be more typical of SDG&E participants than SDG&E's claimed values. |
61 |
SDGE |
Upstream Lighting Res/Com Split - Consistent Application of Updates for the Utilities. |
For ED's final verification report, a 95/5 res/non-res split was applied to SDGE 3016. |
62 |
SDGE |
SPC Realization Rate applied to Bid Program |
Two values were allowed for the realization rate of customer C/I programs. A value of .79 was assigned to "SPC like" programs. A value of 1 was assigned to the remaining programs. Although some differences in delivery are noted for non-SPC programs, they were still considered to be "SPC like". |
63 |
SDGE |
Interactive Effects of Residential Lighting |
For ED's final verification report, results will be presented in three scenarios: 1. Positive Interactive Effects only, 2. With both positive and negative interactive effects, and 3. Without interactive effects. |
64 |
SDGE |
Modeling Issues |
ED can set up meetings with utilities to walk through the model for the 2008 verification report due in August 2009. |
65 |
PGE |
THE 2008 "FINAL" DEER UPDATE THAT IS THE MAIN DRIVER OF THE RESULTS OF THE VERIFICATION REPORT GOES FAR BEYOND THE LIMITED UPDATE ENVISIONED BY DECISION 08-01-042, CONTAINS MANY WRONG CONCLUSIONS UNSUPPORTED BY COMPLETED MEASUREMENT STUDIES AND, AT A MINIMUM, NEEDS A FULL REVIEW BEFORE IT CAN BE USED FOR ANYTHING. |
Energy Division's decision to update ex-ante parameters with values found in DEER is pursuant to D. 08-01-042, OP 3(b). See pages 14 to 16 of that decision for the discussion, "For measures included in the Database for Energy Efficient Resources (DEER), however, we will update the values contained in the E3 calculators with the 2008 and 2009 DEER updates of ex ante measure savings parameters, including net-to-gross ratios and expected useful lives. " |
66 |
|
INTERACTIVE EFFECTS SHOULD NOT BE CONSIDERED AT LEAST UNTIL THE COMMISSION REVISITS THE ENERGY SAVING GOALS |
For ED's final verification report, results will be presented in three scenarios: 1. Positive Interactive Effects only, 2. With both positive and negative interactive effects, and 3. Without interactive effects. |
67 |
PGE |
SPECIFIC COMMENTS 1 NTG |
This comment is specific to how the DEER 2008 update applied a "self report bias adjustment". For this report, ED simply used whatever NTG values were made available with the update. Energy Division may consider adding a self-report adjustment for the final PEB calculation. |
68 |
PGE |
SPECIFIC COMMENTS 2 |
PGE's comment is about the CFL installation rate, basically saying that they should be crediting for bulbs that haven't been installed yet and that the ED should use "ex ante in-service rates" (which for PG&E are 76% but for SCE and SDG&E were 90%) until "data is presented addressing the too-soon-after-purchase data". |
69 |
PGE |
SPECIFIC COMMENTS 3 |
The issue of how the utilities should claim energy savings from CFLs installed after December 31, 2008 is a policy call that needs to be decided but is outside the scope of this report. We address this issue in the final performance basis report. |
70 |
PGE |
SPECIFIC COMMENTS 4 |
· Sample size too small: The sample sizes for the on-sites were generally in line with the sample sizes used for all other PG&E single-family measures as well as similar measures included in SCG's verification analysis. In the next round of verifications, ED can consider this recommendation, but must factor in the overall small contribution these insulation measures make to the single-family component of PGE2000, let alone to the overall PGE2000 program or PG&E's total portfolio. |
71 |
PGE |
SPECIFIC COMMENTS 5 |
Energy Division was not able to research this mathematical error in time. ED will make sure this issue is reviewed and corrected for the final report. |
72 |
PGE |
SPECIFIC COMMENTS 6 |
The simulation model used by DEER, specifically DOE-2.2, has a long history of use in EM&V as well as research across the US and internationally. The ability of DOE-2.2 to model residential and commercial building effects is well established in the literature by numerous studies. The comment seems to imply that studies done on DOE-2.1e, the predecessor of DOE-2.2, cannot be used to validate DOE-2.2 ("not been verified by either EM&V or field studies"). DOE-2.2 is in fact an improvement on DOE-2.1e, not a different program; the authors of DOE-2.2 are also the primary authors of DOE-2.2. In fact, several of the primary improvements to DOE-2.2 over DOE-2.1e are the duct leakage algorithms and attic modeling; these algorithms have be the subject of field verification such as that contained in the NREL (USDOE sponsored) April 2002 report "Thermal Performance of Unvented Attics in Hot-Dry Climates (NREL/TP-550-30839) Additionally, the IOU Standard Performance Contracting (non-res retrofit) and Savings By Design (non-res new construction) programs both rely on DOE-2.2 modeling for all building measure results and include all interactive effects for lighting measures. It should also be noted the DOE-2.2 and DOE-2.1e are the only simulation programs approved by the CEC for use in the non-residential and high-rise residential "performance" method for Title 24 compliance analysis (the whole building analysis rather than prescriptive analysis method of complying with Title 24). Title 24 compliance analysis includes HVAC interactive effects as reported by DOE-2.2 or DOE-2.1e. It should also be noted that most Title 24 research was performed using DOE-2.2 including the non-residential duct sealing research work performed under the PG&E C&S program in support of the 2005 Title 24 non-residential duct sealing standard change. |
73 |
PGE |
SPECIFIC COMMENTS 7 |
The current structure of the earnings mechanism requires point estimates. Historically, point estimates have always driven the earnings calculations in California. |
74 |
PGE |
SPECIFIC COMMENTS 8 |
PG&E cites on page 15 of Appendix A1 to the draft report that the res/non-res split could be 86/14; however, no where in that report is it recommend that PG&E use this information to justify 90/10. PG&E implies that this survey was conducted to provide an answer to the res/nonres question. In fact, the in-store intercept surveys conducted as part of the PG&E process evaluation will provide the most convincing evidence of the res/nonres split. These intercepts are also being conducted in PG&E's service territory as part of the impact evaluation. The results from these intercepts will provide the most reliable source for estimating the actual res/nonres split. |
75 |
PGE |
SPECIFIC COMMENTS 9 |
Energy Division does not agree that PG&E's suggested changes are the best approach. The 2005 evaluation results are believed to be the most accurate. |
76 |
PGE |
SPECIFIC COMMENTS 10 |
EEGA values were only used in cases where the evaluated savings were not available. |
77 |
PGE |
SPECIFIC COMMENTS 11 |
Refrigerator/Freezer recycling measure UES values were corrected. Residential Ceiling insulation measure are not part of the DEER update. |
78 |
PGE |
SPECIFIC COMMENTS 12 |
The latest version of the VRT resolves this issue. Since PG&E's upstream CFL program accomplishments already incorporates an ISR of 76 percent, the VRT now applies an adjustment factor of 88 percent (67 percent / 76 percent) to the upstream CFL program accomplishments to simulate an installation rate of 67 percent for those upstream measures not updated by the interim DEER revisions |
79 |
PGE |
SPECIFIC COMMENTS 13 |
The wording in the Draft Report on table 9 suggests that commitments were included for all, but this is not necessarily the case. In the Final Verification Report, the language around table 9 will be re-worded, but there will likely be no change in the savings amounts. |
80 |
DRA |
Describe whether the E3 calculators used are compliant with all CPUC direction regarding cost-effectiveness calculations, including D.07-09-043's treatment of freeriders. |
The E3 calculators used in the VRT are from http://ethree.com/cpuc_cee_tool.html under the heading "E3 Calculators in Compliance with Decision 07-09-043. Updated 9/22/08." For a description of changes, see: http://www.ethree.com/downloads/E3%20Calculators/Version%204%20Changes.doc |
81 |
DRA |
What is the "sample frame" mentioned in section 5.1.1, page 20? How, if at all, does this impact the need to use tracking database data in the DVR, rather than E3 data? |
The sample frame is defined as a list that includes every member of the population from which a random sample is to be taken. Sampled cases are investigated (e.g., measured and analyzed) and the results are then generalized to the population from which they were originally drawn. Once the decision to use the program tracking data as the inputs into the ES calculator was made, then the sample frame was defined as all records in the IOU program tracking databases. That is, the sample frame does not drive the need to use the tracking database. Rather, it is the decision to use the program tracking database as inputs into the ES calculator that drives the need to form a sample frame comprised of all records in IOU program tracking databases. It is from these frames that random samples were drawn. |
82 |
DRA |
A citation to the record should be provided for footnote 25's discussion of the discount rate |
The footnote has been deleted in the final Verification Report since the discount rate of 7.49% was retained. |
83 |
DRA |
Load shapes and their impact on MW savings should be discussed, since MW savings are driving the incentives claim for PG&E and SCE. |
Load shapes were not adjusted for ED's VR, nor will they be adjusted in time for the 1/15/09 deliverable. The rules for how load shapes were applied in the VRT are described in the VRT and user's manual. |
84 |
DRA |
Detailed Comments and Questions by Section |
DRA proposed adding more information to the report. In the interest of time ED was not able to address most of these questions and make the suggested changes but ED will take these under consideration for the next verification report. |
85 |
DRA |
The Executive Summary should provide a high level summary of the entire report, and should highlight keys issues which impact verified savings performance |
Energy Division appreciates DRA's suggestions and will consider including these modifications in future verification reports; however, in the interest of time, these comments could not be addressed in this report. |
86 |
DRA |
The statement that RRIM allows rewards which are "comparable to what the companies would otherwise earn through supply-side investments" mis-states the record. RRIM earnings "will approach supply-side earnings at a level of superior performance", per D.07-09-043, Finding of Fact 95, page 201 |
Energy Division modified the final report in response to this comment. |
87 |
DRA |
Section 3 should describe EM&V process for 2006-08, the ultimate product of 2006-08 EM&V efforts, the role of interim claims, and how this report is funded. |
Energy Division appreciates DRA's suggestions and will consider including these modifications in future verification reports; however, in the interest of time, these comments could not be addressed in this report. |
88 |
DRA |
Section 4 should include discussion of D.08-01-042 OP2b, pg 25, and how the bar is lowered to 65% of goals in the final claim, if interim claims are awarded based on updated ex ante assumptions, and that interim payments are not refundable if ex post savings exceed 65% of goals. |
Energy Division modified the final report in response to this comment. |
89 |
DRA |
Describe whether the E3 calculators used are compliant with all CPUC direction regarding cost-effectiveness calculations, including D.07-09-043's treatment of freeriders. |
The E3 calculators used in the VRT are from http://ethree.com/cpuc_cee_tool.html under the heading "E3 Calculators in Compliance with Decision 07-09-043. Updated 9/22/08." For a description of changes, see: http://www.ethree.com/downloads/E3%20Calculators/Version%204%20Changes.doc |
90 |
DRA |
What is the "sample frame" mentioned in section 5.1.1, page 20? How, if at all, does this impact the need to use tracking database data in the DVR, rather than E3 data? |
The sample frame is defined as a list that includes every member of the population from which a random sample is to be taken. Sampled cases are investigated (e.g., measured and analyzed) and the results are then generalized to the population from which they were originally drawn. Once the decision to use the program tracking data as the inputs into the ES calculator was made, then the sample frame was defined as all records in the IOU program tracking databases. That is, the sample frame does not drive the need to use the tracking database. Rather, it is the decision to use the program tracking database as inputs into the ES calculator that drives the need to form a sample frame comprised of all records in IOU program tracking databases. It is from these frames that random samples were drawn. |
91 |
DRA |
A citation to the record should be provided for footnote 25's discussion of the discount rate. |
Footnote 25 was removed from the Final Verification Report. |
92 |
DRA |
Load shapes and their impact on MW savings should be discussed, since MW savings are driving the incentives claim for PG&E and SCE. |
Load shapes were not adjusted for ED's VR, nor will they be adjusted in time for the 1/15/09 deliverable. The rules for how load shapes were applied in the VRT are described in the VRT and user's manual. |
93 |
DRA |
A qualitative summary of types of changes in the 2008 DEER updates should be provided. Differences between this and the update used in the DVR should be provided |
Energy Division appreciates DRA's suggestions and will consider including these modifications in future verification reports; however, in the interest of time, these comments could not be addressed in this report. |
94 |
DRA |
Installation rate adjustments should be described in more detail. What is the extent of surveys vs. field measurement? How will this change in the final impact evaluation? What are the types of adjustments (e.g - residential vs. non-residential) and the extent of each type. Why do the residential vs. non-residential rates and storage rates for CFLs matter? |
Energy Division appreciates DRA's suggestions and will consider including these modifications in future verification reports; however, in the interest of time, these comments could not be addressed in this report. |
95 |
DRA |
What did the cost audit entail? How extensive was it? Is it correct to say that the CPUC has verified that the Utilities' reported costs are accurate, except for the issues identified as "not significant" on page 31? |
Energy Division modified the final report in response to this comment. |
96 |
DRA |
The cumulative GWH in Table of 82% does not agree with the 77% value in Table 16B. What are these figures percentages of? |
Energy Division modified the final report in response to this comment. |
97 |
DRA |
It would be helpful if Table 16A showed the impacts of each measure as a percentage of the DVR total savings. A separate table could show reported measure impacts as a percentage of total utility reported impacts |
Energy Division appreciates DRA's suggestions and will consider including these modifications in future verification reports; however, in the interest of time, these comments could not be addressed in this report. |
98 |
DRA |
Why did ED develop the VRT? Will it be used in the final earnings claim? |
ED created the VRT to be transparent, so a reviewer would be able to look at the "verification table" in the VRT and see which values were updated. The VRT also has QC queries built in, so the user and easily compare results. Unless directed otherwise, ED will use the VRT in the 2nd and Final earnings claims. |
99 |
DRA |
DRA suggests that the descriptions of VRT fields and methodologies be moved to an Appendix, and that this section focuses on findings, like describing by type (EUL, UES, NTG, etc.) the impacts of the "update" on claimed savings. |
Energy Division appreciates DRA's suggestions and will consider including these modifications in future verification reports; however, in the interest of time, these comments could not be addressed in this report. |
100 |
DRA |
Table 20 shows how the UES update for each program changes GWh, MW, and Therm savings claims. A similar table should be created for NTG, EUL, installation rate, and every other savings assumption change which had a significant impact on utility savings performance. |
Energy Division appreciates DRA's suggestions and will consider including these modifications in future verification reports; however, in the interest of time, these comments could not be addressed in this report. |
101 |
DRA |
DRA's first read of Table 23 suggested that the utility claims in the PFM, without any updates, were being confirmed by the ED team. However, the energy savings and PEB based on Table 21 are not the same as those in the PFM. Differences in savings level have potential explanations, but DRA is not aware why PG&E's claimed PEB in the PFM ($988 million) is nearly 10% higher than that based on Table 21 ($901 million). Additional definition of "Option 0" and the data in Table 21 may help identify the source of this discrepancy |
Option 0 simply takes the utility calculated values from the utility submitted E3 import/export sheets, and aggregates the savings and net benefits values for each program to the IOU portfolio level. The E3 model is not used to re-calculate values when Option 0 is selected. |
102 |
DRA |
HVAC interactive effect impacts should be presented if they are being considered for inclusion in the final impact evaluations. Regardless of the magnitude or direction of these interactive effects, DRA strongly believes that a consistent approach should be applied across all utilities, and that it must fairly address impacts to SoCalGas for SCE measures which increase heating loads |
ED's Final Results are presented using three different data sets: With Positive Interactive Effects Only, With Both Positive and Negative Interactive Effects, and Without Interactive Effects. |
103 |
SCE |
Residential Interactive Effects Not Valid |
SCE, as does PG&E and SDG&E, refers to comment extensively on a Canadian study released after DEER was released and was not used by the DEER. DEER conducted its work independently. Interactive-effects were discussed in the DEER Unit Energy Savings webinar and follow-on meeting. The utilities seem to claim that when indoor lighting loads are decreased by up to 75% from a CFL or by removal of a refrigerator it will cause no change in gas heating use. The utilities have offered no studies or data to support this claim, and at the same time refuted studies and data that support increase heating due to decrease lighting and other internal loads. Please see comments and responses on interactive-effects in Appendix Q attached. |
104 |
SCE |
DEER Filled With Too Much Uncertainty |
This comment is addressed in the reply to PG&E's comment in Appendix Q. ED agrees that we need to understand the uncertainty in EM&V results and in DEER as well as in utilities' workpaper values. This uncertainty will continue going forward, but ED is actively pursuing more rigorous EM&V activities. ED views the utilities' workpaper values as having similar or higher level of uncertainty, also in some cases using more optimistic values rather than typical values. |
105 |
SCE |
SCE Contests the General Modeling Assumptions in DEER |
ED agrees that DEER values and updates must be undertaken to produce values that better represent typical expected savings, and has driven to ensure that is the result of the DEER updating process. ED disagrees with the commenter's specific criticism that DEER values are not based on current data representing typical savings. For example: A) the existing field data on CFL replacement for incandescents do not support the IOU's lumen mapping method, and actually demonstrates that method over predicts savings. B) DEER refrigerant charge methods are based on field measurements on real operating units. SCE's lab data may not represent field results nor do they represent the wide range of equipment found in the field. C) The utilities'' baseline assumptions on chiller and T12 are based on worst case scenario, where DEER takes into account the variation of existing equipment in the field. Other modeling issues in this comment are addressed in Appendix Q. |
106 |
SCE |
DEER 2008 Bias Is Evident In Calculating Unfavorable Results |
The DEER process is independent and objective. The commenter is not commenting on DEER, but the perceived bias in decisions ED made in the update process. This perceived bias arise in which the utilities take the most optimistic value rather than a typical or expected value in their assumptions, thus the resultant adjustment often tends to be a lowing of the value, moving it from an optimistic to a typically expected one. |
107 |
SCE |
Incorrect Evaluation of Appliance Recycling Program |
The commenter has made numerous incorrect assumption about the modeling and incorrect assumptions for the models. The specifics of correcting the commenter's interpretation were discussed in the DEER webinar and meeting, and are contain in Appendix Q attached. |
108 |
SCE |
New Energy Star Refrigerator Measures |
The DEER team believes that the comment "during the planning of the '09-'11 programs, we noticed that the deemed annual energy savings practically tripled" is in fact an observation of above customer average savings, not above code savings. In the 2008 DEER database, customer average demand savings are three to four times greater than above code demand savings and are therefore three to four times higher than the demand savings reported in 2005. However, the DEER team could not find any instances in the 2008 database where customer average savings were more than about four times the code baseline demand savings. During the webinar for the energy results, the SCE stated that demand results had been taken from the utility's filings. SCE and the DEER team all observed and agreed that the utility's filings had an error that caused demand savings to be under reported by an order of magnitude. Please see responses to comment in Appendix Q attached. |
109 |
SCE |
The values used for the DEER modeling inputs are still somewhat unclear and are not clearly referenced on the DEER website or in the Draft Report. |
On September 19, 2008, the DEER Unit Energy Savings Team conducted a webinar on the MAS Tool. In this webinar, the DEER Team demonstrated how to install and use the MAS tool. Using this software, one can see the various assumptions and information available for any simulated measures under this tool. |
110 |
SCE |
SCE Has Asked For Information That Has Still Not Been Received |
ED believes it has responded to utilities comments as submitted. Please see comments and responses again in Appendix Q attached. In the appendix of this report, ED is re-supply those information and in addition supplying addition information to satisfy the utility's request. |
111 |
PG&E |
The 2008 "final" deer update that is the main driver of the results of the verification report goes far beyond the limited update envisioned by decision 08-01-042, contains many wrong conclusions unsupported by completed measurement studies and, at a minimum, needs a full review before it can be used for anything. |
D.08-01-042 OP 3 directed ED to use measures contained in 'the 2008 and 2009 DEER updates of ex ante measure savings parameters, including net-to-gross ratios and expected useful lives." DEER based its updates on latest evaluations results and other latest information available. The utilities managed the contracts for the 04-05 evaluation studies and were participants in the evaluation studies project advisory teams. The utilities actually had access to these evaluation study results in advance of the DEER team. In the advisory teams, the utilities provided comments on the draft evaluation plans prior to execution, and had opportunities to comment on the draft results. Then in the DEER update public review process, the DEER Team received comments from stakeholders and where errors were discovered, the Team corrected the errors. In cases where the comments warranted a modification of the measure ex ante estimates, the Team revised the estimate values accordingly. The DEER Team did not make a change when not warranted. ED was not limited to using only completed evaluation studies. |
112 |
PG&E |
The 2008 DEER update inconsistently applied a self-report bias adjustment, occasionally taking it into account (e.g., the residential retrofit direct install program) and often ignoring it, resulting in a biased result (e.g., the Standard Performance Contract evaluation, which eliminated such an adjustment for its large customers who participate in its Standard Performance Contracts program without explaining why the self report bias was eliminated. The Evaluator who incorporated the bias correction stated that .05 was eliminated because it was for spill-over, yet did not explain why the remaining .1 correction for self-reporting bias was eliminated.) In other instances, e.g., the Savings by Design programs, the net-to-gross ratio selected by the Energy Division cannot be ascertained from the studies used for the 2008 update. |
The DEER Team's treatment of self-report bias is consistent, and this issue is addressed in the responses to comments during the DEER public review process. Please see Appendix Q attached. |
113 |
SDG&E |
DEER Updates Should be Publicly Vetted and Approved Before Actual Implementation |
The ED DEER vetting process includes a public review and comments period. The ED vetting process is not, nor should it be, a public negotiation of the technical values. The direction given to ED is not to negotiate a value but to establish that a typical or average estimate was based on the most recently available information. See D.05-01-055 Section 5.3.2. This section also addresses utility conflict-of-interest concern in activities involving judgment. |
114 |
SDG&E |
Net-to-Gross studies use controversial methodologies to estimate results. |
ED disagrees with the commenter. Evaluations have been used to develop NTGR values for more than a decade, and as with any estimations relating to accomplishments there is expected to be a variation around the point estimate value that is adopted as the average or typical value. The single point estimates are based on the most reliable methodology available at the time. The net-to-gross methodology documentation, Draft 2006-2007 Ex Ante Net-To-Gross Ratio Update, was posted as part of the public review and comments process. Please see Appendix Q attached. |
VRT 4.5.6 |
21 VRTs using the Interactive Effects 21 VRTs using Positive Interactive Effects 21 VRTs using Non-Interactive Effects |
RRIM spreadsheets for each scenario |
Interim DB documentation |
Interim DB Positive |
Interim DB Interactive |
Interim DB Non-Interactive |
9. CHANGES MADE TO 2ND VERIFICATION REPORT
Parties commented on Energy Division's 2nd Verification Report both in written comments and in person at a transcribed public workshop held on September 16, 2009. Energy Division's responses to these comments are documented below:
VRTs for SCE2501 and SCE2502 were re-run to address the seven problems listed below:
a. Incorrect mapping of DEER 2008 NTG: SCE2501 (upstream) specialty CFLs
b. Incorrect mapping of DEER 2008 NTG: SCE2501 (STAPLE) all measures
c. Incorrect mapping of DEER 2008 NTG: SCE2501 (Home EE rebates) variable speed pool pumps
d. Incorrect mapping of DEER 2008 NTG: SCE2502 All non-lighting measures (cannot apply single family NTG to multi family)
e. Incorrect mapping of DEER 2008 EUL: SCE2501 (STAPLE) torchieres
f. Incorrect mapping of DEER 2008 EUL: In some cases applied an improper Miscellaneous Commercial EUL to a residential program (screw-n dimmable CFL 23 Watt)
g. SCE2502 Mobile Homes should use a DEER NTG value of 85% for Screw-in CFLs and CFL fixtures
# |
Utility |
Comment Page |
Comment |
Energy Division Response |
1 |
SCE |
A-4 |
Interim report fails to include 2008 savings that can be attributed to pre-2006 codes and standards |
Energy Division explicitly acknowledged in the verification report: "Since there was no verification report for 2008 savings that can be attributed to pre-2006 Codes and Standards advocacy work, no additional savings were applied in this analysis." The evaluation for C&S will be released in the Fall of 2009 and the Energy Division's March 2010 report will incorporate these numbers for 2008 C&S savings. |
2 |
SCE |
A-4 |
Committed energy savings from SCE's California New Homes Program and Savings By Design program paid after 2005 appear not to be included |
See explanation in section 5.2.3 of the Draft 2nd Verification Report. |
3 |
SCE |
A-6 |
VRT miscalculates SCE's program expenditures in SCE2502 and SCE2511 that the Interim Report addresses, totaling over $2.6 million |
No miscalculation: The problem here may be due to SCE using the quarterly report instead of the E3 as the source. The E3 workbook filed does show $67,987,130 as the total cost SCE2502. |
4 |
SCE |
A-7 |
Inappropriately mapped or incorrectly mapped climate zones |
We based our mapping on information provided in the IOU tracking databases. For the three zip codes identified as "Not in the CEC table" we looked on Google Earth's CEC CZ website:
http://www.energy.ca.gov/maps/building_climate_zones.html#googleearth. |
5 |
SCE |
A-8 |
Ex-ante unit counts do not match: SCE2502 missing 765,297 units |
We do not see any records or quantity missing. The variable PrgTrk quantity matches the E3 quantity for every single measure for this program (total units = 1,814,739). The EDUpdated quantity is lower (by approx. 63,000 units) as expected per the application of the installation rates. |
6 |
SCE |
A-8 |
Ex-ante unit counts do not match: SCE2511 missing 38,935 units |
This is not a mistake. The verification rate marks down units by 38,935. |
7 |
SCE |
A-8 |
Ex-ante unit counts do not match: SCE2501 missing 78 CFLs |
This difference is due to rounding. Some bulbs fell out of the table due to the reallocation of res/nonres quantities - the calculation resulted in rounding of this reallocation and therefore some bulbs "fell out". In addition, we counted 59 rather than 78 bulbs. Note that 78 bulbs represent s only 0.00021% of the total bulbs. |
8 |
SCE |
A-8 |
Incorrectly applied verification rate: SCE2501 |
Verification rate was applied at the individual participant level and not at the program level - some received lower rates simply because they did not have the entire measure count installed. All others not verified received the overall weighted average installation rate. If the overall installation rate varied between the VRT and the verification report it was due to our recalibration of the installation rate algorithm. |
9 |
SCE |
A-8 |
Incorrectly applied verification rate: SCE2502 |
Verification rate was applied at the individual participant level and not at the program level - some received lower rates simply because they did not have the entire measure count installed. All others not verified received the overall weighted average installation rate. If the overall installation rate varied between the VRT and the verification report it was due to our recalibration of the installation rate algorithm. |
10 |
SCE |
A-9 |
332 instances where installation rate set to zero for SE2502 |
There were 332 instances where the installation was in fact 0 - these records/participants did not have the measure installed. |
11 |
SCE |
A-9 |
Of 63 measures in SCE2511, 33 have a verification rate discrepancy, of which, 15 got a verification rate adjustment but the verification rate should have been 100% |
Sample Design for the 06-07 Verification activities was done by Measure Group, not by Measure Name. Please see Table 5.5 from the verification report for the verification rates used. |
12 |
SCE |
A-10 |
Verification rates not consistent with contractor report for SCE2517 |
Table ES-2a Program-level Verification Rates for SCE2517 by Strata, in the report titled "2008 FIRST VERIFICATION REPORT MAJOR COMMERCIAL CONTRACT GROUP" is consistent with the values shown in the VRT column of SCE's comment table. It is not clear how SCE derived the values it cites under the column titled "Verification Rate in Appendix A3." |
13 |
SCE |
A-11 |
ED should not have used E3 version 4b. Should have used 2009-2011 version or version 4a |
Energy Division used the most current version of the E3 calculator for all the utilities. The CFL example that SCE cited in its comments is incorrect. The 4b version of the calculator does not completely "remove the savings and benefits" but it does adjust savings based on how SCE enters the data in its E3 calculator. |
14 |
SCE |
A-12 |
Incorrect mapping of DEER UES: Irregular updates made to both refrigerator and freezer recycling measures in SCE2500 |
Refrigerator/Freezer recycling measure UESs will not exactly match DEER UESs due to the weighting scheme presented in the SBC documentation. (see p.14, Appendix J, updated on pp.7-8, 7/19/09 SBC report). |
15 |
SCE |
A-12 |
Incorrect mapping of DEER UES: Not all indoor CFL measures were mapped to DEER in SCE2502 even though wattages were available. Also, not all entries of the same measure were updated. |
Per the SBC documentation, only measures that constitute a significant percentage of total utility savings received DEER updates. For a given measure name, only those line items with DEER-mappable climate zone and building type receive DEER updates. For the case of measures with the same measure name that received differing savings, savings vary by climate zone and building type. In some cases, when a building type is not provided in the tracking data, a weighted average building type is used. (see pp.7-12, Appendix J, updated on pp.1-8, 7/19/09 SBC report) |
16 |
SCE |
A-13 |
SCE2517 ex-ante gross kWh were incorrectly updated |
In workpapers "WPSCNRLG0086.0-{124,125}", it appears SCE swapped the savings values going from program tracking to E3. SBW selected the program tracking values in the VRT. |
17 |
SCE |
A-13 |
VRT updates made to indoor lighting measures found in the education - secondary school building type have extremely inaccurate demand savings |
The demand savings given in the example are those directly from DEER. There is no apparent problem with the application of the DEER values. |
18 |
SCE |
A-14 |
Judgment calls used to map DEER to a measure: VRT uses an undocumented approach to average the wattage of screw-in CFLs (since SCE uses 13, 18 and 28 watt CFLs). |
This process is documented in the SBC documentation and was done in consultation with Energy Division and its consultants. (see Appendix J, p.7, 7/19/09 SBC report). |
19 |
SCE |
A-14 |
Residential lighting CFL UES values differ by approximately 1% |
Per the example given, the "discernable reason" would be that the climate zone varies. Different climate zones result in varying DEER savings values, sometimes much greater than 1%. |
20 |
SCE |
A-15 |
SCE2501 has significant discrepancies in the UES values for CFLs, especially when the CFL wattages were in excess of what DEER 2008 contains for nonresidential buildings. |
When a wattage was unavailable in DEER, savings values were either interpolated or extrapolated from DEER savings of given CFL wattages. Details of this process can be found in the SBC documentation. (see Appendix J, p.8, 7/19/09 SBC report). |
21 |
SCE |
A-16 |
As DEER 2008 does not have a multifamily dwelling type, SCE2502's updates were inappropriately made for single family residential applications. |
This comment is not clear. Multi-family CFLs were mapped to DEER impacts for residential single-family building type. Details of this process can be found in the SBC documentation. (see Appendix J, p.8, 7/19/09 SBC report). |
22 |
SCE |
A-16 |
In SCE2517, some measures that are not available in DEER were originally mapped by SCE to a workpaper. These work paper UES values were changed, with no clarification as to where the savings come from |
In workpaper "WPSCNRLG0027", it appears SCE entered different savings values in program tracking and E3. SBW selected the program tracking values in the VRT. |
23 |
SCE |
A-17 |
The interim report continues to incorrectly apply the gross realization rate of 79% to SCE's customized programs |
Energy Division correctly applied the .79 realization rate to the reported measures in SCE's tracking/E3 records. The variance that SCE notes in its comments between our ED updated gross savings and SCE's calculated gross savings is very insignificant (.00651 or .6507%). |
24 |
SCE |
A-23 |
Incorrect mapping of DEER 2008 NTG: SCE2501 (upstream) specialty CFLs |
This was corrected in the final version of the 2nd Verification Report. |
25 |
SCE |
A-23 |
Incorrect mapping of DEER 2008 NTG: SCE2501 (STAPLE) all measures |
This was corrected in the final version of the 2nd Verification Report. |
26 |
SCE |
A-23 |
Incorrect mapping of DEER 2008 NTG: SCE2501 (Home EE rebates) variable speed pool pumps |
This was corrected in the final version of the 2nd Verification Report. |
27 |
SCE |
A-23 |
Incorrect mapping of DEER 2008 NTG: SCE2502 All non-lighting measures (cannot apply single family NTG to multi family) |
This was corrected in the final version of the 2nd Verification Report. |
28 |
SCE |
A-23 |
Incorrect mapping of DEER 2008 NTG: SCE2511 all measures |
The VRT properly used a NTG value of 0.85 |
29 |
SCE |
A-23 |
Incorrect mapping of DEER 2008 EUL: SCE2501 (STAPLE) torchieres |
This was corrected in the final version of the 2nd Verification Report. |
30 |
SCE |
A-23 |
Incorrect mapping of DEER 2008 EUL: SCE2517 Linear fluorescents |
In the DEER08 table we used, grocery lighting hours for non-CFL were 4,886 hours, not 3942 hours as SCE indicated in its comments. If we were unable to map measure name/building type, we reverted to the utility-claimed EUL of 11 years. |
31 |
SCE |
A-24 |
Incorrect mapping of DEER 2008 EUL: SCE2501 CFL EUL in VRT is 6 but DEER 2008 EUL is 6.57 |
The VRT shows an EUL of 6.57. |
32 |
SCE |
A-24 |
Incorrect mapping of DEER 2008 EUL: Nonresidential building types appears to have no clear methodology about how EULs are calculated |
The proper EUL values were used from the DEER 2008 EUL lookup tables. |
33 |
SCE |
A-24 |
Incorrect mapping of DEER 2008 EUL: In some cases applied an improper Miscellaneous Commercial EUL to a residential program (screw-n dimmable CFL 23 Watt) |
This was corrected in the final version of the 2nd Verification Report. |
34 |
SCE |
A-25 |
Incorrect Incremental Measure Cost Assumptions: VRT is over counting the cost factors of SCE advanced CFLs by adjusting the costs of standard upstream CFL by .7444 and adjusting advanced CFLs by .67 |
Advanced CFL's (3-way, dimmable etc) are included in the Upstream CFL program and received a 67% installation rate. Then the gross costs (and rebates) were increased by the inverse of this rate to ensure the TOTAL gross costs in the VRT were equal to the total gross costs as reported in the E3 calculators. |
35 |
SCE |
A-25 |
Incorrect measure cost adjustment: Room ACs adjusted by .96496 but not for all measures. Whole house fans adjusted by a factor of .993631 but not for all measures |
This was to account for the installation rate so the non-unitized gross costs would equal E3 gross costs. For verified participant's records, if the rate was 100%, then their costs would match E3, but if they had a lower install rate, then the costs would be multiplied by the inverse of this install rate. This is explicitly outlined in the VRT documentation. |
36 |
SCE |
A-25 |
Incorrect measure cost adjustment: SCE2511 , 76% of measure costs have been adjusted even though the installate rate factor is 1 |
We have double checked the numbers. We adjusted the tracking measure cost by the inverse of the verification rate for all interior lighting measures. If SCE is comparing the VRT values to the E3 column, this would not be appropriate as we start with the Tracking database values. |
37 |
SCE |
A-26 |
Incorrect measure cost adjustment: SCE2517 80% of the measure contained in SPC were changed without any clear methodology |
As described in the "VRT Rules" (documented in the fields table in each VRT), unitized incremental measure costs and rebate values are adjusted so that the total of these costs are the same as that reported in the E3 filing for each program. The process requires that all program tracking records have a unit count. Some of the SPC records are missing this count. If so, they were either set to count of 1 or to the count found in the project file (this was only for cases that participated in the verification sample). Once all records had a unit count, then the total units (within sample strata) could be recomputed and the unitized costs appropriately adjusted. Further, these unitized costs were adjusted in each strata by the inverse of the installation rate for that strata. All of these adjustments were for the purpose of carrying the same measure and rebate costs, as found in the E3 filing, into the VRT calculation of life cycle costs and benefits. |
38 |
SCE |
A-27 |
Incorrect use of DEER 2008 Climate Zones: numerous DEER values are incorrect because they have been misapplied when climate zone changes were made. |
We based our mapping on information provided in the IOU tracking databases. For the three zip codes identified as "Not in the CEC table" we looked on Google Earth's CEC CZ website:
http://www.energy.ca.gov/maps/building_climate_zones.html#googleearth. |
39 |
SCE |
A-29 to A-40 |
Technical Comments on Verification Reports |
These issues were raised and responded to in the 1st Verification Report. See section 8.4 of the 2nd Verification Report. |
40 |
PGE |
5 |
The verification report should be corrected to remove 2004-2005 data from the cumulative savings goals |
Ordering Paragraph 4(b) or D.07-09-043 adopts a "Cumulative-To-Date" approach and rejects a "Cumulative-Program Cycle Basis." No commission decision to date removing 2004-2005 savings for purposes of calculating the 2006-2008 MPS. |
41 |
PGE |
6 |
The report neglects to provide savings in 2008 for C&S advocacy work |
Energy Division explicitly acknowledged in the verification report: "Since there was no verification report for 2008 savings that can be attributed to pre-2006 Codes and Standards advocacy work, no additional savings were applied in this analysis." The evaluation for C&S will be released in the Fall of 2009 and the Energy Division's March 2010 report will incorporate these numbers for 2008 C&S savings. |
42 |
PGE |
9 |
Any simulated interactive effects should be vetted and testes using real world data (and before adjusting future energy savings goals to reflect such interactive effects). |
DEER interactive-effects impact estimates are developed with simulation programs (such as DOE-2 and eQUEST simulation programs) utilizing "calibrated" models. ED posted the DEER team's methodology for stakeholders review and comments. ED conducted an online webinar and in-person meeting to discuss this topic with stakeholders. Furthermore, please see ANSI/ASHRAE Standard 140 (the most recent edition is 140-2007) "Standard Method of Test for the Evaluation of Building Energy Analysis Computer Programs". The current ANSI/ASHRAE standard would find any program not predicting such an effect to be unacceptable for use in estimating energy use by buildings. Also, the relevant ANSI/ASHRAE standard includes DOE-2.2 as one of its primary published reference programs, the same version of DOE-2 used in DEER modeling. |
43 |
PGE |
9 |
NTG values should not be retroactively applied |
D.08-01-042 instructs ED to update these values |
44 |
PGE |
10 |
EUL values should not be retroactively applied |
D.08-01-042 instructs ED to update these values |
45 |
PGE |
12 |
Res/Non-Res split assumptions should not be adjusted |
Please see ED verification report section 6.5.6 for explanation of why ED chose a 95/5 res/non-res split. |
46 |
PGE |
14 |
67 percent in-service rate is too low for upstream CFLs |
This comment was made and responded to in the 1st Verification Report. See section 8.4 of the 2nd Verification Report. |
47 |
PGE |
15 |
Applying 2006-2007 findings to 2008 program accomplishments is not appropriate for some programs |
Since this is an interim report, any adjustments to installation rates or realization rates will be made in the final Energy Division report based on completed evaluation results. |
48 |
PGE |
16 |
The UES values in DEER for RCA and DTS are questionable |
Our objective for the second verification report was to make an ex-ante update based on the 06-07 DEER update report and MiSER tool. Updating measure savings with field M&V results will be done for the final evaluation report. |
49 |
PGE |
17 |
NTG for industrial programs should be revised |
The VRT simply uses whatever values come from DEER. NTG values were not modified. |
50 |
PGE |
17 |
Table 7 (realization rates) lacks sufficient detail to be verified |
It is unclear what additional detail PGE needs to assess the methodology used. Please refer to Appendix C of the Verification Report for calculations (posted at http://www.cpuc.ca.gov/PUC/energy/Energy+Efficiency/EM+and+V/081117_Verification+Report.htm). |
51 |
PGE |
18 |
Verification report is not correctly accounting for 2004-2005 residential and non-residential new construction program savings |
See explanation in section 5.2.3 of the Draft 2nd Verification Report. |
52 |
PGE |
18 |
Residential retrofit verification rates should be updated |
It is not the intent of the 2nd verification report to update submitted contractor reports. Residential retrofit installation rates will be updated in the final report. |
53 |
PGE |
18 |
The verification report does not account for previously identified errors |
ED responded to comments and made adjustments where Energy Division agreed there were errors. Please see section 8.3 and 8.4 of the Verification Report. |
54 |
PGE |
19 |
The verification report issuance process was not adhered to |
ED notified the ALJ and decided to hold a workshop on 9/16/09. |
55 |
PGE |
19 |
The verification report fails to provide the requisite level of detail to support its findings |
Energy Division provided the source databases we used for this analysis. All information is posted to: www.cpuc.ca.gov/ee under "EMV" --> "Energy Division Verification Report". |
56 |
Sempra |
6 |
Original NTG value for SDGE3016 should be used |
This verification report is not the forum for arguing the DEER NTG values. The verification report team simply applied DEER NTG values to the 2006-2008 measures. |
57 |
Sempra |
6 |
The original ex-ante values for in-service rates should be used for SDGE3016. |
The verification report provides an interim method/result until the 06-08 evaluation results are available. The approach for determining installation rates for the Upstream Lighting Program was provided in detail as part of the evaluation plan available at www.energydataweb.com/cpuc. |
58 |
Sempra |
6 |
The DVR make a number of significant NTG mis-categorizations where the same measure type is inappropriately put into different NTG categories or placed in the wrong category for SDGE3020. |
Assignments were based on the information available. SDGE3020 shows no Direct Install Costs, so we assumed the assignments would be similar to the Express Efficiency program. This was our only option since SDGE3020 was not broken out between Direct Install and Rebate/Express measures. |
59 |
Sempra |
6 |
SDGE3020 lighting measures should use a NTG value of .85 not .78 |
This is not a correction, but a suggestion to not use DEER NTG numbers. |
60 |
Sempra |
7 |
The DVR inappropriately applies a 0.79 savings realization rate to the energy and demand savings for SDG&E's Innovative Bid Program, SDGE3010 |
Energy Division used a .79 realization rate for SPC-like programs for this interim report, but the realization rates will be updated in the final report. |
61 |
Sempra |
7 |
Codes and Standards savings should be applied for 2008 |
Energy Division explicitly acknowledged in the verification report: "Since there was no verification report for 2008 savings that can be attributed to pre-2006 Codes and Standards advocacy work, no additional savings were applied in this analysis." The evaluation for C&S will be released in the Fall of 2009 and the Energy Division's March 2010 report will incorporate these numbers for 2008 C&S savings. |
62 |
NRDC |
2 |
We recommend that the Draft Second Verification Report be expanded to include estimates of program impacts and allowable earnings under both of the alternative approaches proposed by parties to resolve the 2006-08 earnings claims. Calculation and presentation of impacts and earnings under the approaches recommended by the Settling Parties1 and by SCE will provide the Commission with a clear comparison of the proposed alternatives and will facilitate a final decision in that proceeding. |
ED provided scenarios similar to NRDC's request per the ALJ Ruling setting the 9/16/09 workshop. The results of the scenario analysis are attached to the October 1, 2009 ALJ Ruling in R. 09-01-019. |
63 |
SCE and Sempra |
9/16/09 workshop transcript p.130-131 (also through 147) |
Documentation for how appliance recycling was applied was not sufficient, resulting in SCE not being able to replicate the results. |
Energy Division will post another addendum to the CPUC website, "Summit Blue PEB Report 6 Jan 09.doc," that was omitted in prior postings. In addition, further clarification will be posted to the CPUC website in a document titled "Background information on data used to estimate refrigerator and freezer recycling weights.doc" |
64 |
Sempra |
9/16/09 workshop transcript p.152 (also through 159) |
Why didn't Energy Division use the operating hours for commercial customers in SDGE3020 that were provided by Sempra? |
Energy Division can find no email trail of Sempra providing Energy Division operating hours for commercial customers in program SDGE 3020, nor can we find an email trail of the "M&E studies" referenced by Sempra on page 159 of the transcript. |
65 |
Sempra |
9/16/09 workshop transcript p.160-161 |
If when applying interactive effects, Energy Division takes into consideration whether the customer is a gas and electric customer but has gas space conditioning because if "they were not gas space conditioning customers, the negative interactive effect from light should not be applied to them.." |
For the DRAFT 2nd Verification Report, Energy Division did not consider whether a customer has gas space conditioning or not. This factor will be considered in the final evaluation of the portfolio. |
66 |
PGE |
9/16/09 workshop transcript p.170-172 |
PG&E initially identified apparent errors in the verification rates for attic and wall insulation while at one of the workshops following the issuance of the Draft 2006-2007 Verification Report. PG&E has since had further discussions with the evaluators and PG&E understood that revised verification rates had been established. However, no changes were made in this Verification Report or to Appendix A1. |
PGE brought this issue up to Kema via email on February 9, 2009. Kema reviewed this issue with Cadmus, and both Cadmus and Kema agreed that the method used for calculated verification rates for attic and wall insulation are in fact correct. As a result, there was no change to the 2nd Verification Report. PGE misunderstood that "revised verification rates had been established." |
67 |
Sempra |
9/16/09 workshop transcript p.179 |
On the DEER website there is no documentation on how those interactive effects were developed. |
The DEER parameter update values documentation is posted on the website www.deeresources.com. In the DEER Update process, ED's responses to all comments including interactive effects were posted on the ED's Public Document's Area ( http://www.energydataweb.com/cpuc/default.aspx) along with additional supporting information. For the purposes of the Verification Report, these same ED responses to IOUs' DEER comments and additional clarifying information were attached as Appendix Q. |
68 |
Sempra |
9/16/09 workshop transcript p.184 |
DOE-2 type modeling assumptions, whether it be done with Micropas or Energy Pro, need to be documented. |
All DOE-2 simulation inputs and outputs can be reviewed through the use of the MASControl tool. This tool was provided to the utilities, and the ED DEER Team provided an introductory tutorial for the tool on September 19, 2008. |
69 |
TURN |
9/16/09 workshop transcript p.195 |
If "incremental measure cost" is supposed to be independently verified, based on current pricing conditions in the market versus what DEER has and what the utilities reported, and that has not happened, then the report should somewhere upfront state that and be clear that there are two sides to this equation. Most of the time and attention was spent on the savings side, and there's the cost side as well that will be captured in the ex post. And to the extent that the measure cost data, as used by the utilities, are either higher or lower in the market, then their performance earning basis could go up or down. |
Energy Division included additional language in the verification report to clarify that the audit of costs did not verify the utilities reported "incremental measure costs" for their measures. Furthermore, since incremental measure cost were not evaluated compared to current market pricing conditions, the PEB results may either be higher or lower from what was actually calculated in the verification report. |
70 |
All |
9/16/09 workshop transcript p.199 |
In the DEER EUL Lookup spreadsheet, are the EULs for refrigerator and freezer recycling correct? |
The recycling measures do not have both an EUL and RUL, only a single value for measure life that is the life the recycled unit would have remained in service - thus DEER lists these as having only an RUL but placed those values into the EUL table. |
71 |
SCE |
9/16/09 workshop transcript p.202 |
When we say our samples were designed to achieve 90/10 precision, was the 90/10 precision achieved for the installation rate, the pass rate, the failure rate, or the noninstallation rate? |
The sample design for the verification report was actually based on achieving a specified Margin of Error (measured at the 90% confidence level), as opposed to a relative precision. The relative precision is equal to the margin of error divided by the mean. By looking at the margin of error instead of the relative precision, the issue of whether we are looking at the "pass rate" or the "failure rate" is moot because the margin of error is the same for either measurement (however, there could be a huge difference in the relative precision). |
9.3. List of additional documentation
The following are the additional VRT files added to the list of appendices.
RRIM VRT_DB 2006-08 (v4_5_6) (SCE2501_INTER_X).mdb
RRIM VRT_DB 2006-08 (v4_5_6) (SCE2501_NON_X) .mdb
RRIM VRT_DB 2006-08 (v4_5_6) (SCE2501_POS_X) .mdb
RRIM VRT_DB 2006-08 (v4_5_6) (SCE2502_INTER_X) .mdb
RRIM VRT_DB 2006-08 (v4_5_6) (SCE2502_NON_X) .mdb
RRIM VRT_DB 2006-08 (v4_5_6) (SCE2502_POS_X) .mdb
In addition, the RRIM Spreadsheet output files are also provided:
RRMCalculator_Interactive_10-15-09_Option3_v5.xls
RRMCalculator_Non-Interactive_10-15-09_Option3_v5.xls
RRMCalculator_Positive_10-15-09_Option3_v5.xls
Finally, the following report will be posted to the CPUC, as it was erroneously left out when the DRAFT 2nd Verification Report was posted:
Background information on data used to estimate refrigerator and freezer recycling weights.doc
Summit Blue PEB Report 6 Jan 09.doc
Appendices may be downloaded from:
http://www.cpuc.ca.gov/PUC/energy/electric/Energy+Efficiency/EM+and+V/
or
Appendix A1: Residential Program Verification Report
Appendix A2: Small Commercial Program Verification Report
Appendix A3: Major Commercial Program Verification Report
Appendix A4: Industrial Program Verification Report
Appendix A5: Local Government Program Verification Report
Appendix B: List of 2004-2005 Evaluation Reports and Workbooks used to Calculate Savings
Appendix C: Calculation of Realization Rates for 2004-2005 Programs
Appendix D: 2004-2005 Savings Calculations
Appendix E: DEER EUL Workbook
Appendix F: VRT Users Manual
Appendix G: VRT and Associated Files
Appendix H: Statewide Utility Codes and Standards Program Interim Verification Report
Appendix I: Reserved for 2006-2007 Financial Audit Reports
Appendix J: Methods for Updating DEER Values
Appendix K: SCE CFL Workpaper
Appendix L: Workpaper for Measure Group Definitions
Appendix M: 1994 CFL Study
Appendix N: List of Materials Available upon Request
Appendix O: Additional Documentation for Final Report
Appendix P: Comments on the Draft Report
Appendix Q: DEER Comments and Responses
Appendix R: Additional Documentation for 2nd Verification Report
Appendix S: Additional Documentation for 2nd Verification Report 10-15-09
1 Available at http://docs.cpuc.ca.gov/word_pdf/FINAL_DECISION/73172.PDF and http://docs.cpuc.ca.gov/word_pdf/FINAL_DECISION/78370.pdf
2 "Utilities" or "IOUs" refer to Pacific Gas and Electric Company (PG&E), Southern California Edison Company (SCE), San Diego Gas and Electric Company (SDG&E), and Southern California Gas Company (SoCalGas).
3 Hereinafter referred to as "1st Verification Report" or "2006-2007 Verification Report."
4 Hereinafter referred to as "2ndt Verification Report" or "2006-2008 Verification Report."
5 See Section 6.5.8 for a description of the interactive effects issue.
6 Available at http://www.cpuc.ca.gov/PUC/energy/electric/Energy+Efficiency/EM+and+V/
7 http://docs.cpuc.ca.gov/PUBLISHED/FINAL_DECISION/57756.htm
8 http://docs.cpuc.ca.gov/EFILE/RULINGS/63120.htm
9 http://docs.cpuc.ca.gov/EFILE/RULINGS/80684.htm
10 Please see http://cpuc.ca.gov/PUC/energy /Energy+Efficiency/EM+and+V/081117_Verification+Report.htm for all appendices and attachments
11 Available at http://docs.cpuc.ca.gov/word_pdf/FINAL_DECISION/73172.PDF and http://docs.cpuc.ca.gov/word_pdf/FINAL_DECISION/78370.pdf
12 "Utilities" or "IOUs" refer to Pacific Gas and Electric Company (PG&E), Southern California Edison Company (SCE), San Diego Gas and Electric Company (SDG&E), and Southern California Gas Company (SoCalGas).
13 Available at http://docs.cpuc.ca.gov/word_pdf/FINAL_DECISION/40212.pdf.
14 http://www.cpuc.ca.gov/PUC/energy/electric/Energy+Action+Plan/
15 Energy Action Plan II, adopted by the CPUC in October 2005 in collaboration with the California Energy Commission, refined and strengthened the foundation prepared by EAP I and identified further actions necessary to meet California's energy needs. EAP II continues the strong support for the loading order articulated in EAP I. The loading order describes the priority sequence for actions to address increasing energy needs and identifies energy efficiency and demand response as the State's preferred means of meeting those needs. Energy Action Plan II is available at www.cpuc.ca.gov/PUBLISHED/REPORT/51604.htm.
16 DEER is available at http://www.deeresources.com/
17 Available at http://www.cpuc.ca.gov/PUC/energy/electric/Energy+Efficiency/EM+and+V/.
18 EEGA is the Energy Division's web-based report repository accessible at http://eega.cpuc.ca.gov for 2004-2005 programs and http://eega2006.cpuc.ca.gov for 2006-2008 programs.
19 The term "Contract Group" is used to generally refer to the 13 EM&V contracts, the contractors responsible for performing the work under those 13 contracts, and the groups of programs those contractors are responsible for.
20 Available at http://www.cpuc.ca.gov/PUC/energy/electric/Energy+Efficiency/EM+and+V/
21 http://docs.cpuc.ca.gov/PUBLISHED/FINAL_DECISION/57756.htm
22 http://docs.cpuc.ca.gov/EFILE/RULINGS/63120.htm
23 http://docs.cpuc.ca.gov/EFILE/RULINGS/80684.htm
24 http://docs.cpuc.ca.gov/EFILE/RULINGS/63294.htm
25 It should be noted that ED believes the utilities continue to be out of compliance with the 2/21/2006 ALJ ruling issued in R.01-08-028 and the 8/8/2007 ALJ ruling issued in R.06-04-010, both of which require the utilities to report measure level data that is not aggregated in any way in their quarterly reports.
26 Ordering Paragraph 3 of D.08-01-042, provided in section 3.1.1.
27 All of the E3 spreadsheets can be found under the "Quarterly Reports" link on http://eega2006.cpuc.ca.gov
29 http://www.deeresources.com/
30 All of the workpapers can be found under the "Quarterly Reports" link on http://eega2006.cpuc.ca.gov.
31 Available at eega.cpuc.ca.gov. Click "View Public Reports," check disclaimer box, click "view all programs" or select from menus, Annual reports did not include program-ID specific information for several of the programs in this list. Requests for disaggregated data were made to the utilities by Energy Division.
32 Net realization rates were not provided in the SBD evaluation. Therefore, the adjustment factor in Table 7 was derived from the evaluation's impact reporting table by dividing the net ex-post savings by the gross ex-ante savings and applied to the gross program savings as reported in the EEGA workbook. Gross savings are not provided in the annual report, but net savings in the final EEGA workbooks and in the annual report were nearly identical. For Savings by Design only, the missing portion of ex-ante savings was credited to SCE and PG&E (see Appendix C for calculations).
33 Available at http://www.liob.org/docs/LIEEPY05FinalReport1-10-08.pdf
34 Available upon request
35 The E3 Calculator used by each IOU support a maximum number of measure line items on the "input" sheet. The number varies across the versions for each IOU.
36 E3 Calculators in Compliance with Decision 07-09-043. Updated 9/22/08.
37 The RRIM Calculator is described in Section 7 of this report and is provided as part of Appendix G.
38 http://www.deeresources.com/deer2008exante/downloads/DEER_NTG_Values_and_Literature_Review_2008-10-10.zip
39 http://www.deeresources.com/deer2008exante/downloads/EUL_Summary_10-1-08.xls
40 Provided in Appendix E
41 http://www.census.gov/eos/www/naics/
42 For example, DEER reports annual savings for furnace as "Therms/ kBtuh", whereas program tracking data reports annual savings as "per furnace". In case of a 72 kBtuh furnace, a multiplier of 72 was applied to the DEER per unit savings figure to resolve this difference in units. No change was made to the program tracking data, only DEER per unit savings were adjusted when necessary to match tracking data units.
43 ED is given discretion to use recently completed evaluation studies to update ex-ante estimates per Ordering Paragraph 3c of Decision 08-01-042.
44 Completed on September 30th, 2008 by SCE. Available at www.calmac.org.
45 Completed on June 7th, 2006 by SoCalGas. Available at www.calmac.org.
46 Provided in Appendix K
47 Provided in Appendix M
48 Personal communication KEMA staff to Tim Drew of Energy Division October 28, 2008
49 Personal communication KEMA staff to Tim Drew of Energy Division October 28, 2008
50 See Appendix A5
