Table 2
The data strongly suggest that the Commission's GO 156 program has helped California's largest utilities to increase the procurement percentage of WMDVBEs from single digits to more than twenty percent (20%). As a result, diverse business enterprises now procure billions of dollars in annual revenue from Commission-regulated utilities. On the other hand, not all of the utilities, or even all of the largest, have met their program goals especially for MBEs and DVBEs.
Close scrutiny of the data also indicates that WMDVBE procurement is not spread evenly throughout product and service categories. Commission staff has reviewed utility reports and observed that WMDVBE procurement is usually much lower in professional service categories, e.g., legal, financial, consulting, and engineering services, than in so-called "blue collar" categories, e.g., auto dealers and gasoline service stations, building construction, etc. For example, Table 3 below shows the procurement dollars from WMDVBE financial suppliers for calendar year 2008.
Table 3
2008 Financial Services
UTILITY |
WMDVBE Financial Services |
Total Financial Services |
Percent |
AT&T |
$8,380,000 |
$44,296,000 |
18.92% |
|
|
|
|
PG&E |
$30,514 |
$24,951,663 |
0.12% |
|
|
|
|
SCE |
$682,119 |
$15,479,566 |
4.41% |
|
|
|
|
SCG |
$469,915 |
$9,787,537 |
4.80% |
|
|
|
|
SDG&E |
$340,235 |
$6,802,366 |
5.00% |
|
|
|
|
VERIZON |
$0 |
$2,252,067 |
0.00% |
|
|
|
|
TOTAL |
$9,902,783 |
$103,569,199 |
9.56% |
In total, the six largest utilities spent less than ten percent (9.56%) of their total 2008 financial procurement dollars on contracts with WMDVBE suppliers.12 This is an increase from 2007 where less than 4% of their total financial procurement dollars went to WMDVBE suppliers, but still significantly less than other categories of procurement.
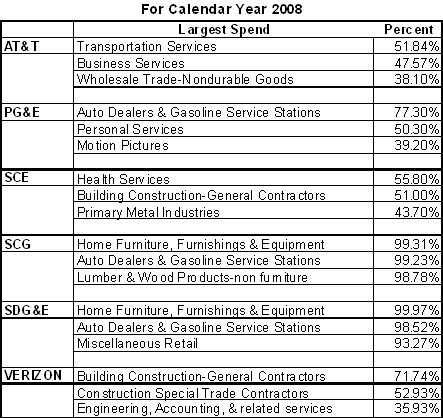
Table 4 below illustrates in some detail the categories most heavily used by the six largest utilities when awarding contracts to WMDVBE suppliers as reported for 2008.
Table 4

The percentages above are of total spend in each specific area. For instance, for
every dollar that AT&T spent on transportation services $0.52 went to a WMDVBE
supplier.
Section 8.11 of GO 156 states, "Each utility shall make special efforts to increase utilization and encourage entry into the marketplace of WMDVBEs in product or service categories where there has been low utilization of WMDVBEs, such as legal and financial services, fuel procurement, and areas that are considered technical in nature." The Commission has previously recognized and attempted to address continued disparity in diversity contracting. During its 2006 public hearing on diversity programs, the Commission initiated a new focus on expanding efforts in the areas of legal services and financial services, areas of spend that are traditionally underrepresented in WMDVBE procurement. As a result, the utilities' procurement levels in both legal and financial services appear to have increased in both 2007 and 2008. 13 However, the results were neither uniform among utilities nor up to program goals.14 This rulemaking will provide an opportunity for the Commission to consider new efforts and practices to expand WMDVBE contracting to underutilized categories of procurement.
As a point of reference, the Maryland Public Service Commission recently addressed the procurement disparity issue with regard to utility supplier diversity programs in that state by reaching agreement for new voluntary goals for its regulated utilities boosting their contracting targets for women-, minority-, and disabled veteran-own business to an aggregate twenty-five percent (25%).15 "There are so many different ways to include minority suppliers," said LaWanda Edwards, a spokeswoman for the Commission. "Accounting, financial services, legal, construction, materials . . . expanding the list of services is part of the goal here."16 The Commission is interested to hear whether an increase in target goals for California regulated utilities would be useful in achieving a better balance among procurement areas. For example, the results in Table 2 show that three of the largest utilities are achieving about 30% procurement from certified diversity suppliers, suggesting that the current 21.5% aggregated goal may be too low.
12 The 2008 data is preliminary and is subject to adjustment.
13 Report at 1.
14 Report at 14. 2008 data for legal services is not yet available.
15 The Washington Post, "Md Utilities Boost Goals for Minority Contracting," at D4, February 9, 2009.
16 The Washington Post, "Md Utilities Boost Goals for Minority Contracting," at D4, February 9, 2009.


