III. California Measures of Service Quality and Standards
A. GO 133-B Measures, Standards, and Caveats
The Commission adopted GO 133-B to establish uniform standards of service for all telephone utilities providing service in California. Pursuant to NRF Monitoring Report requirements, Pacific and Verizon are required to compile monthly data and submit quarterly reports on the following service quality measures8:
Table 1: GO 133-B Measures and Standards
Service Measure |
Description |
Standard |
1. Held Primary Service Orders 2. Installation-Line Energizing Commitments 3. Customer Trouble Reports 4. Toll Operator Answering Time (OA) 5.Directory Assistance Operator Answering Time (DA) 6. Trouble Report Service Answering Time (TRSAT) 7. Business Office Answering Time (BOAT) |
Requests for primary telephone service delayed over 30 days due to lack of telephone utility plant Requests for establishment or changes in non-key telephone individual and party-line service that normally involve plant activity Initial reports from customers and users of telephone service relating to dissatisfaction with telephone company-provided equipment and/or service The percentage of toll and assistance calls answered within 10 seconds The percentage of directory assistance calls answered within 12 seconds The percentage of trouble report calls answered within 20 seconds The percentage of business office calls answered within 20 seconds | No standard established 95% commitments met 6 reports per 100 lines for units with 3,000 or more lines 8 reports per 100 lines for units with 1,001-2,999 lines 10 reports per 100 lines for units with 1,000 or fewer lines 85% 85% 80% 80% |
There have been many criticisms throughout this proceeding of ambiguities and omissions of GO 133-B pertaining to issues such as the definition of "primary line", use of automated response units, and the count of busy or abandoned calls. We describe and discuss the most significant.
1. Definition of "Primary Line" is Unclear
There is disagreement about what GO 133-B means when it requires carriers to report held "primary" service orders. ORA contended the term "primary" means, essentially, that Pacific and Verizon must report data about all basic exchange service lines to a household, regardless of the number of lines at issue. Pacific contended that "primary" refers only to the first line in the house, and not additional lines. Although we believe that ORA's arguments are most persuasive, we find ourselves left with the data in their current state. We note that we have opened a general rulemaking on service quality that will review our GO 133-B measures.9 It is clear that this rulemaking will offer the best forum for resolving this issue.
2. Automated Response Units (ARU)
Another general criticism of the GO 133-B reporting is that GO 133-B fails to address the use of Automated Response Units (ARUs). Indeed, neither Pacific10 nor Verizon report or track11 the time a customer spends navigating the companies' ARUs before reaching a live operator. This omission complicates interpreting the carriers' response times in their Business Office Answer Time (BOAT) reports and in connection with their reported Trouble Report Service Answer Time (TRSAT) reporting.
The time a customer spends in "voice mail jail," as some refer to it, may well be as long or longer than the time the customer spends talking to a live operator or service representative. Indeed, since our answer time standards under GO 133-B require "operators," "service attendants" and "business office representatives" to answer calls within mere seconds, it is probable that callers spend more time navigating voice mail menus than during their prescribed seconds-long wait for a company representative.
We find that the evidence in this proceeding substantiates this assumption, at least as to Pacific's residence customers. Pacific stated that the time its residence customers spend in its ARU system ranges from a low of 50 seconds to a high of 300 seconds - that is, from a range of almost 1 minute to 5 minutes.12 After that, Pacific places customers in a waiting queue for another 35 seconds on average before reaching a live operator.13
GO 133-B's failure to address the use of ARUs reflects changes in technology since the Commission adopted the standard, and this technology gap should be closed.14 Thus, the use of ARUs will likely require a modification of GO 133-B, for without this measure we do not have an accurate picture of the service provided to customers.
3. Busy or Abandoned Calls Not Counted Under GO 133-B
GO 133-B does not track busy or abandoned calls. TURN argued that a large percentage of either could indicate poor customer service. While some FCC requirements cover these calls, they only do so as part of the time-limited merger monitoring reports we discuss later in this decision. Once again, GO 133-B's failure to require tracking busy and abandoned calls may cause us to miss an important element of customer dissatisfaction.
4. Commission Recognizes Need to Revise GO 133-B
We recently instituted a rulemaking to examine GO 133-B in its entirety as it applies to all carriers.15 That rulemaking will consider what changes to existing GO 133-B measures and standards are appropriate. The Commission may use the record of this proceeding to assist it in making its decisions regarding how to revise GO 133-B. However, where it is clear that Pacific or Verizon are not properly interpreting the requirements of GO 133-B, this decision will identify such misinterpretations and order conforming changes.
Based on the evidence in this proceeding, it is very clear that GO 133-B should be amended. Because a change to GO 133-B would affect other carriers besides Pacific and Verizon, this change would appropriately occur outside this proceeding, and is best addressed in our Service Quality OIR (R.02-12-004).
In addition, the evidence in this proceeding establishes that data collected under the Order are not always identical among carriers or from year to year for each service quality measure due to the composition of the data underlying the reported service quality results. We acknowledge the limitations of using such data. However, until uniform standards for data collection are established, we have to draw our conclusions based on the existing data.
B. Performance of Pacific and Verizon Against GO 133-B Measures
As noted above, the GO 133-B measures and standards are the principal service quality measures used by this Commission to promote the quality of landline telephone service in California. For this reason, we begin our assessment by examining the performance of Pacific and Verizon against our standards and over time.
1. Held Primary Service Orders
a) Position of the Parties
Pacific reported that its held primary service order count has significantly improved since early 1990s. Pacific's witness Dr. Hauser stated that Pacific had no held orders from January to March 2002 and just a single held order in 2001.16 The chart below shows Pacific's data for the period 1990 through 2001.17
ORA challenged Pacific's held order data. GO 133-B defines a held order as "[r]equests for primary (main) telephone service delayed over 30 days for lack of utility plant." ORA and Pacific strongly disagree on the interpretation of the term "primary telephone service." ORA contends that "primary service" is a class of service that includes basic exchange service and that the sequence of lines to an address is not a factor in the definition of primary service.
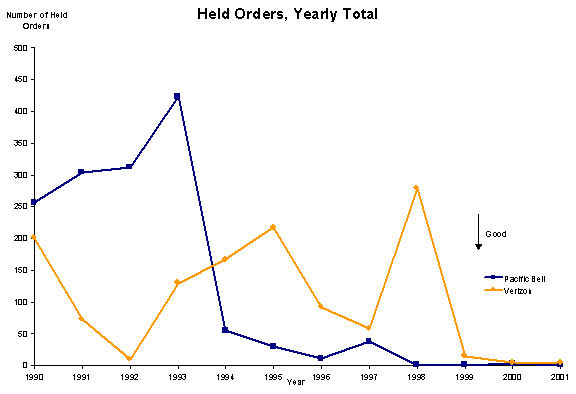
Pacific defines "primary service" as the first line into a home. ORA claims that Pacific is erroneously relying - out of context - on a definition contained in our rules for the California High Cost Fund-B (CHCF-B), which define a "primary line" in this manner: "Primary Line: For the purposes of the CHCF-B, `primary line' is the first line to [a] household."18 This difference in interpretation clearly affects Pacific's reporting of held orders. If, as ORA contends, Pacific is supposed to be counting all lines into the home as long as they deliver "basic exchange service," then its held order figures could be higher than Pacific reports.
Verizon, in contrast to Pacific, defines "primary line" as any basic service line into a house or business. Verizon reported that "the number of primary service orders exceeding 30 days has shown improvement, with annual totals in single digits for the years 2000 and 2001, with only 5 and 4 orders respectively exceeding the GO 133-B threshold. The annual average for the years 1993 through 1998 was 155 held orders."19
TURN "took no position on the content of the GO 133-B installation reporting of Pacific and Verizon."20
b) Discussion: Measurement Problems for Pacific Preclude any Finding; Verizon's Performance Fluctuated with No Significant Trend
We agree with Pacific that GO 133-B is ambiguous on the definition of "primary line." Although we prefer ORA's definition on a going forward basis, for this proceeding Pacific's interpretation is acceptable. We therefore do not take action against Pacific at this time. We further note, however, that our Service Quality OIR is taking a close look at GO 133-B and intends to consider this definitional issue in that forum.
The Commission has not set any standards for the held order count and the data reported by Pacific has shown an improving trend for this measure. However, the parties have expressed concerns regarding Pacific's data gathering methodology. GO 133-B requires that carriers report orders that are held - that is, remain pending - for more than 30 days beyond the commitment date ("held orders").21 According to its testimony, Pacific counts such orders once a month. This creates a result that is inconsistent with GO 133-B's intent that any order older than 30 days be reported to the Commission.
When Pacific's witness Mr. Resnick explained Pacific's practice, it became clear that Pacific does not capture all relevant orders because it counts such orders only once a month. For example, under certain circumstances, Pacific's practice does not count an order that is 48 days overdue as a held order:
Q. Resnick, let's say a customer ordered primary residential service and the commitment date is set for December 29th. We are going to do this as a hypothetical. Due to problems establishing facilities at the customer's residence the line is not installed until February 14th, resulting in a 48-day installation interval from the initial commitment date. Do you have those hypothetical facts in mind, sir?
A. Yes.
Q. In your opinion does this installation meet the GO 133(b) definition of a held order?
A. No.
Q. Why not, sir?
A. . . . [T]he way we measure our GO 133 per the guidelines that are set forth by the Commission, we measure held orders that are held for facilities over 30 days on the 25th of the month. So in this case we would look at January 25th as reporting date for GO 133. We would look back on any orders that were held for more than 30 days past the commitment date. In this case it was not. And so then it would not qualify. The following month, the subsequent month, February 25th, we would look back and this order would have been completed, so therefore it would not count.22
This method of counting is inconsistent with the requirement of GO 133-B that "An order will count as held when service is not provided within 30 days after commitment date." (Section 3.1(a)). Pacific's method results in it not reporting some orders held up to two months, making its reported performance appear better than its actual performance.
Within 30 days of the effective date of this decision, Pacific shall file a compliance document in this docket indicating that it has conformed its practice to the plain meaning of GO 133-B.23 Pacific shall, at the very least, change its practice of counting held orders so that it counts such orders as often during the month as is necessary to ensure that all orders for which Pacific does not provide service within 30 days after the commitment date show up in Pacific's held order reporting. It is not acceptable for Pacific to continue its current method of making the count, as that practice causes Pacific to under-report its results.
Even though a limited definition of primary line and a faulty definition of held order contaminate an interpretation of this measure, statistical methods enable us to analyze the time trend in Pacific's reported measure. An examination of the chart shows a dramatic decline in held orders. A statistical examination of Pacific's performance over the period from 1990 to 2001 shows that Pacific's performance has improved substantially in its unique and strange measure of held orders.24 However, we decline to make a finding in this area because of the substantial problems associated with Pacific's measure of primary lines and its erroneous measurement of held orders.
A visual review of the chart indicates that Verizon's performance has fluctuated considerably, with marked improvement in recent years. Verizon had 201 held orders in 1990. It dropped to 10 in 1992 and then peaked to 279 in 1998. In the last three years Verizon has improved its performance in this area. Verizon's performance across the eleven-year period as a whole does not show either a statistically significant linear improvement or decline.25
2. Installation-Line Energizing Commitments
a) Position of the Parties
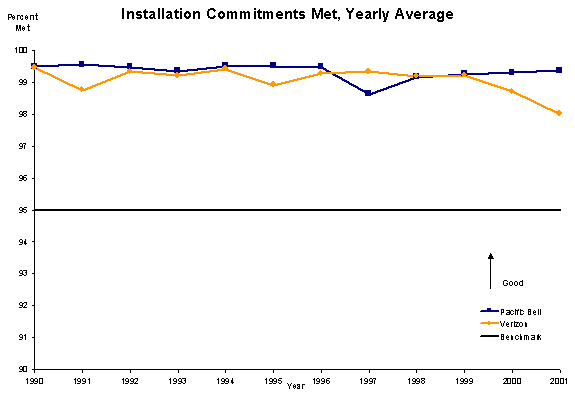
Pacific claimed it met and exceeded the GO 133-B installation-line energizing commitment standard for all of the NRF period.26
Verizon reported that it has "met a minimum of 98% of its basic installation order commitments over the past nine years, well above the GO 133 B standard."27 The chart below shows Pacific's and Verizon's annual28 performance from 1990 to 2001.29
b) Discussion: Pacific and Verizon Met GO 133-B Standard for Honoring Installation Commitments
Parties have not contested Pacific's performance in this area. The data and the graph above show that Pacific has consistently exceeded the benchmark of meeting 95% of all line-energizing service installation orders for the years 1990 through 2001 (the solid line indicates the standard). Pacific's annual average has been over 99 percent for eleven years out of twelve. In addition, for the 144 months for which we have data, Pacific has met the standard in every month. This leads us to conclude that Pacific has a record of compliance with this standard. In addition, we have not observed any significant linear trend in the annual average of Pacific's installation commitments met.30
Turning now to Verizon, even though we observe a slight decline in Verizon's trend, it is not statistically significant.31 Verizon has consistently exceeded the GO 133-B standard. In addition, for the 144 months for which we have data, Verizon has met the standard in every month. Further, no party contested Verizon's performance measure. We conclude that Verizon's performance has complied with this standard.
3. Customer Trouble Reports
a) Position of the Parties
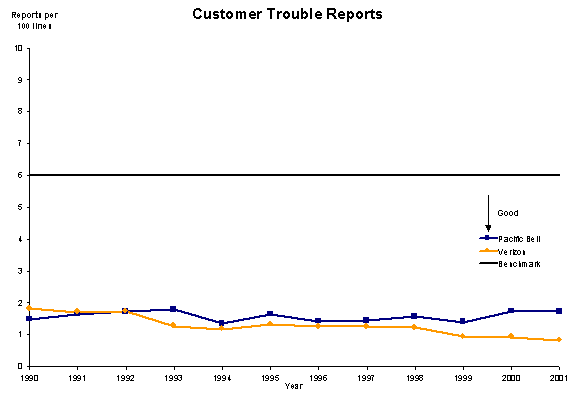
Pacific reported that customer trouble reports occurred about 1.0 to 1.8 times per 100 lines from 1990 to 2001.
Verizon reported that "[its] network trouble reports per 100 access lines have not exceeded the GO 133-B standards since at least 1986. In that year, the trouble report rate was 3.4 reports per 100 lines. The rate declined to 1.3 by 1993 and averaged approximately 1 report per 100 lines between 1996 and 2001."32 The following chart shows the annual performance of Pacific and Verizon for the period from 1990 to 2001.33
b) Discussion: Pacific and Verizon Met GO 133-B Standard for Incidence of Trouble Reports
A visual inspection of the chart above indicates that Pacific and Verizon have consistently exceeded the benchmark of no more than 6 trouble reports per 100 lines (the solid line on our graph). In addition, both Pacific and Verizon met the standard for each of the 144 months for which we have data. The statistical analysis also indicates that there was no significant linear trend in Pacific's performance over the period under consideration.34 On the average, Verizon has slightly improved its performance over the years.35
4. Toll Operator Answering Time
a) Position of the Parties
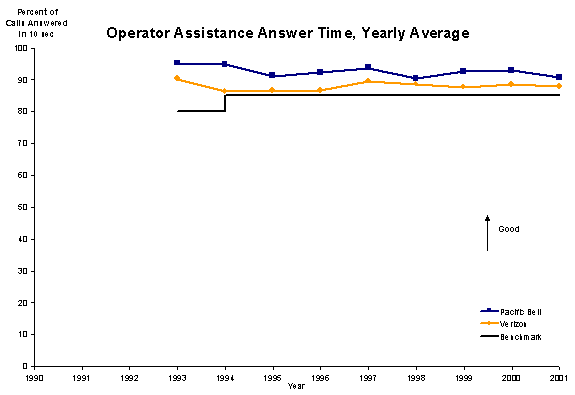
Pacific reported that the trend in operator assistance answer time, also known as toll operator answering time, has met and exceeded GO 133-B standards since the early 1990s.36
Verizon stated that "[its] responsiveness to customers calling for toll or directory assistance operators has consistently reflected a high level of service quality, as evidenced by the percentages of calls answered within the ten second and twelve second thresholds established by GO 133-B."37
No other party addressed this measure.
The following chart demonstrates Pacific's and Verizon's annual performance from 1993 to 2001.38 The horizontal black line shows the benchmark standard, which rose from answering 80% of all calls within 10 seconds to 85%.
b) Discussion: Pacific and Verizon Met GO 133-B Standard for Toll Operator Answer Time
A review of the graph above shows that Pacific has met and exceeded the benchmark of answering 85% of all operator assistance calls in 10 seconds over the period under consideration. Monthly data show that Pacific has met the standard in 107 of the 108 of the months for which we have data. A closer inspection of the graph shows that Pacific's performance peaked in 1993 and has not reached the same level since then. Nevertheless, statistical analysis finds no statistically significant time trend in operator assistance answer time.39
In terms of annual averages, Verizon has also exceeded the benchmark since 1990. Its best performance was 90.25% in 1993. The monthly data show that Verizon has met the standard for 140 of the 144 months. We do not observe any significant trend in Verizon's performance.40
5. Directory Assistance Operator Answering Time
a) Position of the Parties
Pacific reported that the trend in directory assistance answering time has exceeded the GO 133-B standard of answering 85% of all directory assistance calls within 12 seconds since the early 1990s.41
Verizon also reports a record of compliance with the standard.
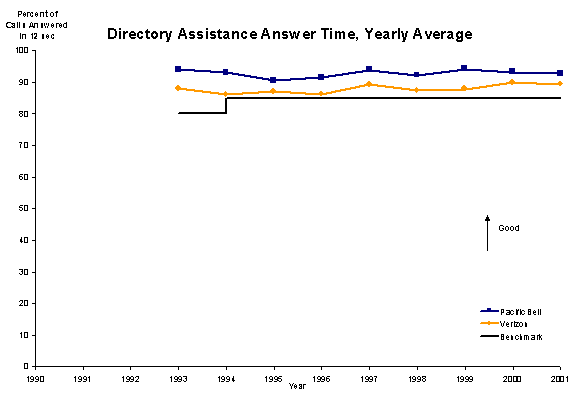
The following chart demonstrates the annual performance of Pacific and Verizon.42 Once again, the solid horizontal line represents the performance standard.
b) Discussion: Pacific and Verizon Met GO 133-B Standards for Directory Assistance Answer Time
As a review of the graph indicates, Pacific has consistently exceeded the benchmark from 1993 to 2001. The annual average of Pacific's performance has been over 90 percent for all years under consideration - an average of over 90 percent of directory assistance calls were answered within 12 seconds. Pacific met the standard in each of the 108 months for which we have data. We find no statistically significant upward or downward linear trend.43
We find that Verizon has also exceeded the benchmark. Verizon met this performance standard in 106 of the 108 months beginning with 1993. In addition, in the prior period for which the standard was maintaining an average directory assistance answer time of 9 seconds, Verizon met this performance standard for every month in the period from 1990-1992. Thus, Verizon met the directory assistance answer time standard for 142 of the 144 months under NRF. We find no statistically significant upward or downward trend.44
6. Trouble Service Answering Time
a) Position of the Parties
Pacific reported that the percentage of trouble service calls answered on time - trouble report service answering time (TRSAT) - has shown steady improvement since 1996. Pacific has exceeded the standard - answering 80% of all calls within 20 seconds - every year starting in 1999.45
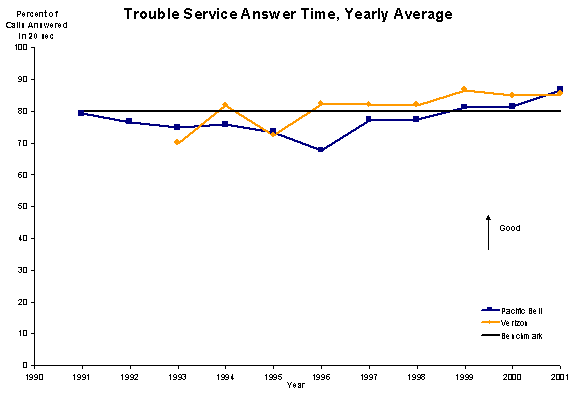
Verizon also shows a pattern of improvement, and has met the standard every year since 1996. The following chart demonstrates Pacific's and Verizon's annual performance from 1991 through 2001.46
b) Discussion: Pacific Did Not Meet GO 133-B Standard for TRSAT from 1991-1998, But Has Met the Standard Since 1999; Verizon Did Not Meet Standard in 1993 and 1995, But Has Generally Met Standard Since 1996
On an annual average basis, Pacific's performance was below the standard of 80% of calls answered within 20 seconds from 1991 through 1998, a lengthy period of noncompliance. In D.97-03-067, the Commission threatened Pacific with sanctions if it continued to fail to meet the standard. Pacific's performance has met the standard on an annual basis and shown improvement in 1999 through 2001. The monthly data show that Pacific met the standard for 92 of the 132 months for which we have data, or 70% of months. Pacific's performance does not show a statistically significant linear improvement over the NRF period 1991-2001.47
On an annual basis, Verizon's TRSAT failed to meet the minimum standard of 80% of calls answered within 20 seconds in 1993 and in 1995. The monthly data show that Verizon met the standard for 104 of the 132 months for which we have data, or 79% of the time. Verizon has met the standard every month since December 1996.
We do not agree with TURN that these results for Verizon can be attributed to the Commission's action against Pacific after the Commission's Pacific Telesis-SBC merger order (D.97-03-067) threatened Pacific with sanctions for noncompliance with the TRSAT standard. The connection between the two actions is not only too tenuous to draw conclusions with any certainty, but is also undermined by the fact Verizon generally exceeded the TRSAT minimum standard after D.94-06-011 and before the Commission issued the merger order.
Overall, we find that, while Verizon had problems with respect to trouble report answer time in the early NRF period, Verizon appears to have developed a consistent track record of solid performance since then. On average we find that Verizon had an improving trend in this area.48
7. Business Office Answering Time (BOAT)
a) Position of the Parties
Pacific claimed that the percentages of business office calls answered on time - within the twenty second standard -- have shown steady improvement since 1996, and has exceeded the standard every year starting in 1997.49
Verizon claims that "the Business Office and Customer Care or Repair Centers have improved on the speed of answer requirements set by the PUC and since the 1996/1997 timeframe, both the Business Office and Customer Care Centers have consistently exceeded the levels established by the PUC."50
TURN stated that Pacific's alterations to its GO 133-B BOAT reporting has made it impossible to compare either Pacific's performance over time or to Verizon (or other carriers) without adjustments to reinclude data that Pacific excluded.51 In particular, up until February 1999, calls regarding billing were included in Pacific's BOAT reporting. Using raw data obtained from Pacific, TURN recalculated Pacific's results for 1999, 2000, and 2001 to include billing-related calls. TURN believes that the adjusted data better reflects Pacific's performance over time.
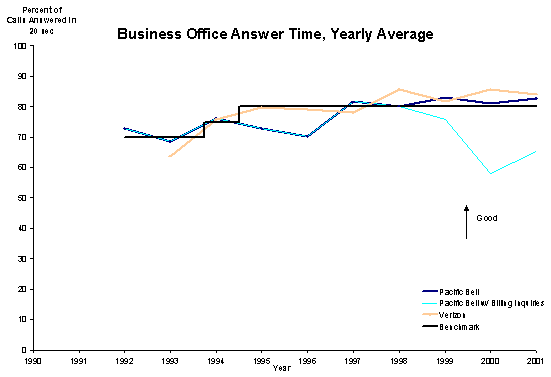
The following chart shows Pacific's and Verizon's annual performance in this area.52 For Pacific, we have included a line reflecting the adjusted data for 1999-2001 offered by TURN that includes billing-related calls. The stepping horizontal line illustrates the performance standard and how it has changed over time.
b) Discussion: Pacific Did Not Meet BOAT Standard in 1993, 1995 and 1996, Has Met BOAT Standard Since 1997, and Shows Declining Performance Since 1998; Verizon Did Not Meet BOAT Standard in 1993, 1996 and 1997 and Has Met BOAT Standard Since 1998
The BOAT measure was added to GO 133-B in 1992,53 and the minimum standard, measured as the percent of calls answered within 20 seconds, was progressively increased from 70% beginning on December 3, 1992, to 75% (beginning October 4, 1993), to 80% (beginning July 5, 1994). (See horizontal line on graph).
Pacific changed its practice regarding inclusion of billing calls in its BOAT reporting. Pacific now excludes billing calls, but included them in its GO 133-B reporting up until February 1999. This exclusion, however, is actually the required practice, because GO 133-B Section 1.3.b defines Business Office as "a Centralized Service Group which receives Small Business and/or Residence Customer requests for new installations or change in existing service. This does not include billing center inquiries." Nevertheless, Pacific's actions to correct this error make it difficult to draw conclusions regarding the meaning of this measure for service quality. Billing inquiries are a major source of customer interaction with the utility, and clearly of interest to those assessing the quality of service. The adjusted data that include billing calls show that, when the same data are included throughout the period under study, Pacific's performance declined notably after 1998, falling as low as the 50-60% range.
Despite the fact that the GO 133-B standard requires the exclusion of billing inquiries, TURN alleges that Pacific's answer times for billing calls are so poor as to warrant a finding that Pacific has violated Pub. Util. Code § 451. Pacific only answered 20% of billing calls in 20 seconds at one point after February 1999 (GO 133-B requires 80% of business office calls to be answered in that time), and the rate has only improved to approximately 50% of late.54 Moreover, when these calls are included in the BOAT measure, Pacific's performance falls to 68% of calls answered within 20 seconds, far below the GO 133-B standard.
Both Pacific and TURN recognize that the Commission has not set standards for billing call answer times. In addition, GO 133-B has specifically required their exclusion from its aggregate measure. Since GO 133-B specifically excludes billing inquiries from its measure of BOAT, we do not find that Pacific's performance of 68% or fewer calls answered within 20 seconds is a violation of GO 133-B standards, when billing calls are included in that measure. Therefore, we do not find a § 451 violation of this standard. Nevertheless, Pacific's performance concerning billing call answer time is clearly deficient. The failure of this Commission to establish a billing call answer time measure is a gap that the Commission should rectify in R.02-12-004.
Pacific also once included DSL-related information in its GO 133-B data, but stopped doing so when it moved its DSL functions into a separate subsidiary. Thus, this measure has been highly unstable during the reporting period, making it particularly difficult to draw any conclusion concerning the trend in performance.
Based on the data submitted by Pacific, we find that, based on the annual data, Pacific did not meet the GO 133-B standard in 1993, 1995 and 1996. Pacific's performance has met the standard since 1997. The monthly data show that Pacific met the BOAT standard for 67 of the 109 months for which we have data, or 61.5% of the time. Even though there is a statistically significant positive trend in Pacific's performance, it appears that this improvement is due to the exclusion of billing calls after 1999 or Pacific's actual improvements in performance.55 When we adjust Pacific's data to include billing calls after 1999, there is no statistically significant linear trend of improvement.56
We find that, based on annual data, Verizon's BOAT results failed to meet the minimum standard of 80% of calls answered within 20 seconds during the period from 1993 through 1997. Verizon's BOAT performance was clearly substandard during the early part of the NRF period, but has shown steady improvement since 1997. In particular, Verizon failed to meet this performance standard in 1993, 1996 and 1997, but met the BOAT performance standard in 1994, 1995, and 1998-2001. The monthly data show that Verizon met the standard for 80 of the 109 months for which we have data, or 73.4 % of the time. Overall, Verizon has had a positive performance trend in this measure.57
As noted above, GO 133-B defines "Business Office" as "A Centralized Service Group which receives Small Business and/or Residence Customer requests for new installation or change in existing service. This does not include billing center inquiries."58 However, Verizon states that it includes billing inquiries in its BOAT measure.59 We do not wish to discourage such voluntary over inclusion, but we will require Verizon to notify us if it seeks to discontinue reporting billing inquiries. As we note elsewhere in this decision, one important use of the GO 133-B data is that we can use it to analyze a carrier's performance over time. Such comparability requires that a carrier seek prior Commission authorization before making changes to the way it reports its data. This is an issue that urgently requires resolution in our service quality rulemaking, which should not only make these measures consistent across companies, but also manage the changes in the data included in measures so to preserve the meaningfulness of these measures.
C. Summary of Empirical Assessment of Pacific's and Verizon's Performance on GO 133-B Measures
Concerning the six GO 133-B measures for which the Commission has required systematic reporting and established standards, the table below summarizes the performance of Pacific in meeting that standard. In particular, we note that for the first four measures, "installation commitments met," "repair reports per 100 lines," "operator assistance answer time," and "directory assistance answer time," we find that Pacific has met or exceeded every GO 133-B for every month but one. For "trouble report service answer time, Pacific met the standard 69.7% of the months for which we have data. For "business office answer time," Pacific met the standard only 61.5% of the time. Pacific's problems with respect to the trouble report and business office answer time standards led the Commission to admonish Pacific in D.97-03-067.
|
Summary of GO 133-B Performance for SBC California January 1990 through December 2001 | |||
For measures with standards |
|||
Total of All Monthly Performance | |||
CPUC GO 133-B Measurement |
Total Months Reported |
Months Meeting standard |
Percent Meeting Standard |
Percent Installation Commitments Met |
144 |
144 |
100.0% |
Repair Reports Per 100 Lines (RPHL) |
144 |
144 |
100.0% |
Operator Assistance Answer Time |
108 |
107 |
99.1% |
Directory Assistance Answer Time |
108 |
108 |
100.0% |
Trouble Report Service Answer Time (TRSAT) |
132 |
92 |
69.7% |
Business Office Answer Time (BOAT) |
109 |
67 |
61.5% |
With respect to the seventh GO 133-B measure, held orders (for which there is no standard), Pacific's faulty definition of held order prevents us from reaching a finding.
With respect to trends in the annual data, Pacific has shown no statistically significant change in the percentage of line-energizing installation commitments met, the number of customer trouble reports per 100 lines, the yearly average of toll operator assistance answer time, and the yearly average of directory assistance answer time, and trouble service answer time. On business office answer time, Pacific's exclusion of billing-related calls beginning in 1999 precludes us from making any finding regarding the trend of performance. However, when billing calls are included throughout the NRF period, Pacific's performance declined after 1998. On no GO 133-B measure of service quality for which we can make findings did Pacific show statistically significant increases or decreases in performance during the period under NRF regulation.
Turning to Verizon, concerning the six GO 133-Bmeasures for which the Commission has required systematic reporting and has adopted a standard, the table below summarizes the performance of Verizon in meeting that standard. In particular, we note that for the first four measures, "installation commitments met," "repair reports per 100 lines," "operator assistance answer time," and "directory assistance answer time," Verizon has met or exceeded every GO 133-B for every month but six - or in 97% or more of the months for which we have data. For "trouble report service answer time, Verizon met the standard 78.8% of the months for which we have data. For "business office answer time," Verizon met the standard only 73.4% of the time.
|
Summary of GO 133-B Performance for Verizon California For the Period January 1990 through December 2001 | |||
CPUC GO 133-B Measurement |
Total of All Monthly Performance | ||
Total Months Reported |
Months Meeting standard |
Percent Meeting Standard | |
Percent Installation Commitments Met |
144 |
144 |
100.0% |
Repair Reports Per 100 Lines (RPHL) |
144 |
144 |
100.0% |
Operator Assistance Answer Time |
144 |
140 |
97.2% |
Directory Assistance Answer Time |
144 |
142 |
98.6% |
Trouble Report Service Answer Time (TRSAT) |
132 |
104 |
78.8% |
Business Office Answer Time (BOAT) |
109 |
80 |
73.4% |
During the NRF period, when measured on an annual basis, Verizon's performance showed statistically significant improvement on trouble service answer time and on business office answer time, as well as the number of customer trouble reports per 100 lines. Verizon has shown no statistically significant change on the held orders, the percentage of line-energizing installation commitments met, the yearly average of toll operator assistance answer time, and the yearly average of directory assistance answer time. On no GO 133-B measure of service quality did Verizon show statistically significant decreases in performance during the period under NRF regulation. Indeed, here we find evidence that Verizon's performance under NRF either showed no statistical change or improvement on the GO 133-B measures.
56 Using our linear trend analysis, the value of b for Pacific with billing data is -.84 with t-statistic -.86. The negative value of b indicates a declining trend, but the t-statistic indicates that this decline is not significantly different from no linear change, at either the 1% or 5% level (R-square: 0.10, no. of observations: 9).
57 Using our linear trend analysis, the value of b for Verizon was 2.025 with a t-statistic 3.78, significant at 1% level (R-square: 0.67, no. of observations: 9). 58 Id., Section 1.3(b). 59 22 RT 2786:10-17 (statement by Verizon's counsel).


