O R D E R
IT IS ORDERED that:
1. Southwest Gas Corporation (Southwest) shall file, within 10 days of the effective date of this decision, revised tariff schedules for gas rates as set forth in Appendices D and E of this order. The revised tariff schedules shall reflect a four-year phase-in of the additional revenue requirement adopted in this order for Northern California. The phase-in of the additional revenue requirement shall be according to the following schedule: 80% in 2003; 10% in 2004; 5% in 2005, and 5% in 2006. In addition, Southwest is authorized to amortize the current balance in the Revenue Recovery Shortfall Memorandum Account (RRSMA) in rates for 2003 and 2004.
2. Southwest's revised tariff schedules shall become effective thirty days after the effective date of this decision, and shall comply with General Order 96-A.
3. Southwest shall close the RRSMA effective with the date of this order.
4. Southwest is authorized to establish a revenue balancing account to track the differences between actual sales and sales adopted in this order. The revenue balancing account shall become effective no earlier than 30 days after the effective date of this order.
5. Southwest may continue to include pipeline demand charges, fixed storage charges and core margin revenue in the Core Fixed Cost Adjustment Mechanism.
6. Southwest is directed to develop discrete rate components for its interstate pipeline demand charges in its next General Rate Case (GRC).
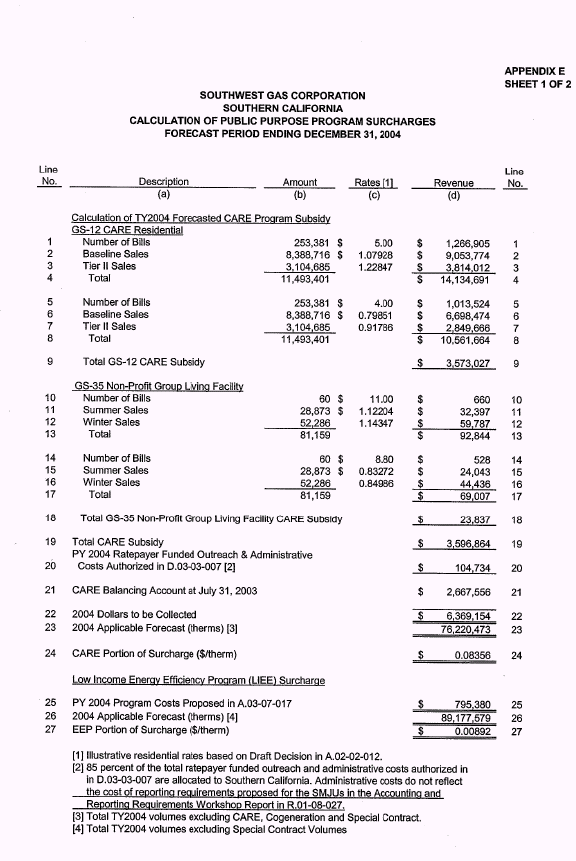
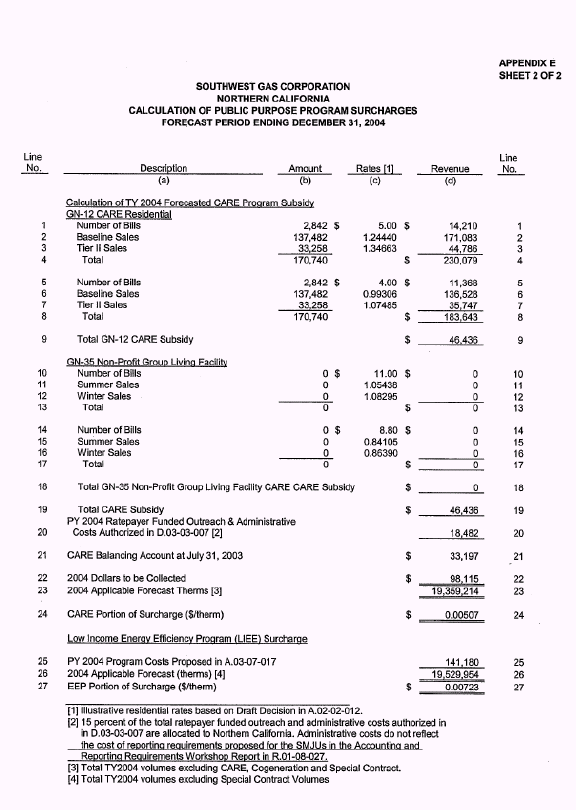
7. Southwest is authorized to implement the public purpose program surcharge adjustments contemplated in D.03-03-007, shown on Appendix E.
8. In its next GRC, Southwest shall provide the Commission with an independent audit administered under the trustees of the Post Retirement Benefits Other than Pensions (PBOPs) trust account that clearly explains, when and how Southwest will use its PBOPs trust account to fund retiree's PBOPs expenses.
9. In its next GRC, Southwest must justify the reasonableness of the $30 million in software projects currently included in Construction Work in Progress balances before any of these amounts may be included in plant-in-service for rate recovery.
10. Southwest shall file with the Commission (the Director of Energy Division) annual reports addressing Southwest's pipeline replacement program beginning November 1, 2004, with subsequent reports on November 1, 2005, and November 1, 2006. The reports shall be in the same form as those filed by Pacific Gas and Electric Company, and included as Exhibit 103 in this proceeding.
11. Southwest is authorized to file advice letters and supporting workpapers requesting attrition year adjustments to rates for 2004, 2005, and 2006. The attrition year adjustments shall be calculated consistent with the Office of Ratepayer Advocates modified attrition year proposal, and may include an index adjustment based on a seven-year constant dollar historical average of non-pipeline replacement-related capital expenditures. Southwest is authorized to include revenue requirements for attrition in addition to revenue requirements that are phased-in during the four-year phase-in period.
12. Southwest is authorized to include the revenue requirements for its Truckee Operational Center in its Northern California attrition request beginning 2004. The revenue requirement for the Truckee Operations Center shall include supporting workpapers.
13. Application 02-02-012 is closed.
This order is effective today.
Dated _____________________, at San Francisco, California.
APPENDIX A
Appendix A |
||||||||||||
Adopted System Allocable Administrative and General Expenses (2001$) (1) | ||||||||||||
Acct 920 | ||||||||||||
2000 Recorded |
Escalated by 0.6% |
|||||||||||
Labor |
23,866,381 |
24,009,579 |
||||||||||
Labor Loading |
9,674,344 |
11,066,015 |
||||||||||
M&E |
(1,898,377) |
(1,898,377) |
||||||||||
Total |
31,642,348 |
33,177,217 |
||||||||||
Acct 921 |
||||||||||||
Labor |
0 |
|||||||||||
Labor Loading |
0 |
|||||||||||
M&E |
6,359,153 |
|||||||||||
Acct 922 |
||||||||||||
Labor |
0 |
|||||||||||
Labor Loading |
0 |
|||||||||||
M&E |
(5,851,383) |
|||||||||||
Acct 923 |
||||||||||||
Labor |
0 |
|||||||||||
Labor Loading |
0 |
|||||||||||
M&E |
4,874,919 |
|||||||||||
Acct 924 |
||||||||||||
Labor |
0 |
|||||||||||
Labor Loading |
0 |
|||||||||||
M&E |
158,790 |
|||||||||||
Acct 925 (2) |
||||||||||||
Labor |
0 |
|||||||||||
Labor Loading |
0 |
|||||||||||
M&E |
1,995,258 |
|||||||||||
Acct 926 (3) |
||||||||||||
Labor |
0 |
|||||||||||
Labor Loading |
0 |
|||||||||||
M&E |
(112,861) |
|||||||||||
Acct 930.1 |
||||||||||||
Labor |
64,983 |
|||||||||||
Labor Loading |
29,950 |
|||||||||||
M&E |
10,038 |
|||||||||||
Total |
104,970 |
|||||||||||
Acct 930.2 |
||||||||||||
Labor |
0 |
|||||||||||
Labor Loading |
0 |
|||||||||||
M&E |
2,185,959 |
|||||||||||
Acct 931 (esc.) |
||||||||||||
Labor |
0 |
|||||||||||
Labor Loading |
0 |
|||||||||||
M&E |
2,674,962 |
|||||||||||
Acct 931 (fixed) |
||||||||||||
Labor |
0 |
|||||||||||
Labor Loading |
0 |
|||||||||||
M&E |
2,104,032 |
|||||||||||
Acct 935 |
||||||||||||
Labor |
198,774 |
|||||||||||
Labor Loading |
91615 |
|||||||||||
M&E |
1,009,043 |
|||||||||||
Total |
1,299,432 |
|||||||||||
Notes: (1) The numbers are from 08-26-2002 correction of ORA's calculations for A&G Workpapers forwarded to SWG. |
||||||||||||
(2) The calculations made by ORA are modified to remove only 50% of the insurance premiums. |
||||||||||||
(3) ORA's Report on the Results of Operations for the Southern and Northern California Divisions of SWG GRC Volume I page 6-3. | ||||||||||||
Southwest Gas Corporation Southern California Adopted Operating Expenses (2001$) |
|||||||||||
Other Gas Supply Expense |
|||||||||||
Labor |
57,165 |
||||||||||
Labor Loading |
26,347 |
||||||||||
M&E |
6,514 |
||||||||||
Total |
90,026 |
||||||||||
Distribution (1) |
|||||||||||
1999 |
2000 |
2001 |
3-Yr Average |
||||||||
Labor |
4,392,645 |
4,294,025 |
4,368,238 |
||||||||
Labor Loading |
2,015,940 |
1,955,690 |
2,014,486 |
||||||||
Materials and Expenses |
2,469,894 |
2,973,242 |
2,923,708 |
||||||||
Rents |
Labor |
0 |
0 |
0 |
|||||||
Labor Loading |
0 |
0 |
0 |
||||||||
Materials and Expenses |
274,415 |
298,339 |
179,264 |
||||||||
Distribution Excluding Rents |
Labor |
4,392,645 |
4,294,025 |
4,368,238 |
4,351,636 |
||||||
Labor Loading |
2,015,940 |
1,955,690 |
2,014,486 |
||||||||
Materials and Expenses |
2,195,479 |
2,674,903 |
2,744,444 |
2,538,275 |
|||||||
Distribution Including Rents |
Labor |
4,351,636 |
|||||||||
Labor Loading |
2,005,669 |
||||||||||
Materials and Expenses |
2,717,539 |
||||||||||
Total Distribution |
9,074,844 |
||||||||||
Customer Accounts (2) |
|||||||||||
Account Number |
1999 |
2000 |
2001 |
3-yr avg |
(d)*#customers |
w/labor loading |
Total | ||||
(a) |
(b) |
(c) |
(d) |
(e) |
|||||||
Supervision |
901 |
||||||||||
Labor |
306,187 |
338,874 |
342,161 |
||||||||
Labor Loading |
140,894 |
154,197 |
157,414 |
||||||||
Materials & Expenses |
28,570 |
39,473 |
78,974 |
||||||||
Normalization factor for labor |
1.063 |
1.028 |
1 |
||||||||
Normalization factor for materials |
1.036 |
1.00 |
1 |
||||||||
# Customers |
100,963 |
103,467 |
104,573 |
||||||||
Labor(2001$) |
325,462 |
348,362 |
342,161 |
||||||||
Material (2001$) |
29,598 |
39,473 |
78,974 |
||||||||
$/customer (Labor) |
3.22 |
3.37 |
3.27 |
3.29 |
362,057 |
528,930 |
581,421 | ||||
$/customer(material) |
0.29 |
0.38 |
0.76 |
0.48 |
52,491 |
||||||
Meter Reading Expense |
902 |
||||||||||
Labor |
459,544 |
480,153 |
517,306 |
||||||||
Labor Loading |
211,662 |
218,782 |
238,471 |
||||||||
Materials & Expenses |
92,470 |
71,391 |
86,561 |
||||||||
Normalization factor for labor |
1.063 |
1.028 |
1 |
||||||||
Normalization factor for materials |
1.036 |
1.00 |
1 |
||||||||
# Customers |
100,963 |
103,467 |
104,573 |
||||||||
Labor(2001$) |
488,473 |
493,597 |
517,306 |
||||||||
Material (2001$) |
95,799 |
71,391 |
86,561 |
||||||||
$/customer (Labor) |
4.84 |
4.77 |
4.95 |
4.85 |
534,344 |
780,623 |
871,174 | ||||
$/customer(material) |
0.95 |
0.69 |
0.83 |
0.82 |
90,550 |
||||||
Customer Records & Collections Expense |
903 |
||||||||||
Labor |
1,474,725 |
1,523,058 |
1,611,626 |
||||||||
Labor Loading |
675,881 |
694,786 |
746,736 |
||||||||
Materials & Expenses |
1,015,819 |
1,134,690 |
1,261,072 |
||||||||
Normalization factor for labor |
1.063 |
1.028 |
1 |
||||||||
Normalization factor for materials |
1.036 |
1.00 |
1 |
||||||||
# Customers |
100,963 |
103,467 |
104,573 |
||||||||
Labor(2001$) |
1,567,561 |
1,565,703 |
1,611,626 |
||||||||
Material (2001$) |
1,052,389 |
1,134,690 |
1,261,072 |
||||||||
$/customer (Labor) |
15.53 |
15.13 |
15.41 |
15.36 |
1,691,260 |
2,470,761 |
3,698,713 | ||||
$/customer(material) |
10.42 |
10.97 |
12.06 |
11.15 |
1,227,951 |
||||||
Postage increase |
30,670 | ||||||||||
Total |
3,729,383 | ||||||||||
Uncollectibles |
904 |
||||||||||
Net Operating Revenue |
39,376,901 |
||||||||||
Revenues from Special Contracts |
456,975 |
||||||||||
Uncollectibles Rate |
0.1925% |
||||||||||
Total |
74,921 |
||||||||||
Misc. Customer Accts. Expense |
905 |
||||||||||
labor |
53,703 |
53,106 |
64,493 |
||||||||
Labor Loading |
24,740 |
23,986 |
29,739 |
||||||||
Materials & Expenses |
38,014 |
35,664 |
34,204 |
||||||||
Normalization factor for labor |
1.063 |
1.028 |
1 |
||||||||
Normalization factor for materials |
1.036 |
1 |
1 |
||||||||
# Customers |
100,963 |
103,467 |
104,573 |
||||||||
Labor(2001$) |
57,083 |
54,593 |
64,493 |
||||||||
Material (2001$) |
39,382 |
35,664 |
34,204 |
||||||||
$/customer (Labor) |
0.57 |
0.53 |
0.62 |
0.57 |
62,766 |
91,695 |
130,676 | ||||
$/customer(material) |
0.39 |
0.34 |
0.33 |
0.35 |
38,981 |
||||||
CS&I |
|||||||||||
Labor |
6,007 |
||||||||||
Labor Loading |
2768.63 |
||||||||||
Materials & Expenses |
-1,055 |
||||||||||
Total |
7,721 |
||||||||||
A&G (Direct) |
|||||||||||
Account no. |
|||||||||||
923 |
17,448 |
||||||||||
925 |
130,578 |
||||||||||
928 |
27,467 |
||||||||||
926 |
8,457 |
||||||||||
930 |
113,016 |
||||||||||
935 |
223,113 |
||||||||||
Notes: |
|||||||||||
(1) Recorded distribution expenses, including rents, are from ORA's Report on the Results of Operations for the Southern and Northern California Divisions of SWG GRC (Volume I, Table 9-2, page 9-9). | |||||||||||
(2) The recorded expenses for 1999 and 2000 are from SWG's Results of Operation Volume II-A Chapter 12 Sheet 3 of 3. The recorded expenses for the year 2001 are from ORA's Report on the Results of Operation Volume I Chapter 10. The number of 2003 customers is forecasted as 110,132 by SWG. | |||||||||||
Southwest Gas Corporation Northern California Adopted Operating Expenses (2001$) | |||
Other Gas Supply Expense |
|||
Labor |
10,244 |
||
Labor Loading |
4,721 |
||
M&E |
1,173 |
||
Total |
16,138 |
||
Distribution |
|||
Distribution Excluding Rents |
|||
Labor |
606,427 |
||
Labor Loading |
279,502 |
||
M&E |
562,918 |
||
Total |
1,448,847 |
||
Rents |
|||
Labor |
0 |
||
Labor Loading |
0 |
||
M&E |
229,507 |
||
Total |
229,507 |
||
Customer Accounts (Direct) |
|||
Labor |
261,860 |
||
Labor Loading |
120,691 |
||
M&E |
208,453 |
||
Total |
591,004 |
||
CS&I |
|||
Labor |
10,809 |
||
Labor Loading |
4981.87 |
||
M&E |
25,644 |
||
Total |
41,435 |
||
A&G (Direct) |
|||
923 |
76,275 |
||
925 |
22,304 |
||
926 |
0 |
||
928 |
5,264 |
||
930 |
19,747 |
||
935 |
19,154 |
||
(END OF APPENDIX A)
APPENDIX B
Pipeline Replacement Expenses
Southern California
Year |
PVC Footage Replaced88 (000s of feet) |
PVC Footage Remaining1 as of 12/31/02 (000s of feet) |
1997 |
- |
5,191.4 |
1998 |
113.8 |
5,077.6 |
1999 |
184.8 |
4,892.8 |
2000 |
236.3 |
4,656.5 |
2001 |
430.2 |
4,226.3 |
2002 |
727.289 |
3,4992 |
Estimated by Southwest Gas |
Adopted | |
2003 |
379.4 |
286.8 |
2004 |
367.5 |
286.8 |
2005 |
367.5 |
286.8 |
2006 |
162.2 |
286.8 |
2007 |
158 |
286.8 |
Annual Expenses (2003-2007) | |||||
Description |
Footage |
Cost/Foot |
Direct Cost |
Overheads 12.48% |
$ Before Esc. |
Mains |
182,000 |
$24.69 |
$4,493,889 |
$560,837 |
5,054,727 |
Services |
104,800 |
$23.26 |
$2,437,323 |
$304,178 |
2,741,501 |
Annual Expenses (2003-2007) |
|||||
Description |
Footage |
Cost/Foot |
Direct Cost |
Overheads 12.48% |
$ Before Esc. |
Mains |
25,000 |
$24.69 |
$ 617,293 |
$77,038 |
694,331 |
(END OF APPENDIX B)
(END OF APPENDIX C)
SOUTHWEST GAS CORPORATION | |||||||||||||||
NORTHERN CALIFORNIA | |||||||||||||||
SUMMARY OF THE OVERALL RESULTS OF OPERATIONS | |||||||||||||||
FOR THE TWELVE MONTHS ENDED DECEMBER 31, 2003 | |||||||||||||||
Line |
Test Year |
Deficiency |
Test Year |
Line | |||||||||||
No. |
Description |
(at present rates) |
(at present rates) |
(at proposed rates) |
No. | ||||||||||
(a) |
(c) |
(d) |
(e) |
||||||||||||
1 |
Operating Revenue |
$ |
21,030,293 |
$ |
3,269,370 |
$ |
24,299,663 |
1 |
|||||||
2 |
Gas Cost |
12,299,073 |
(535,381) |
11,763,692 |
2 |
||||||||||
3 |
Operating Margin |
$ |
8,731,220 |
$ |
3,804,751 |
$ |
12,535,971 |
3 |
|||||||
8,731,220 |
3,804,751 |
12,535,971 |
|||||||||||||
Operating Expenses |
|||||||||||||||
4 |
Other Gas Supply |
$ |
16,139 |
$ |
$ |
16,139 |
4 |
||||||||
5 |
Distribution |
1,678,353 |
1,678,353 |
5 |
|||||||||||
6 |
Customer Accounts |
592,473 |
2,598 |
595,071 |
6 |
||||||||||
7 |
Customer Service & Information |
41,435 |
41,435 |
7 |
|||||||||||
8 |
Sales |
0 |
0 |
8 |
|||||||||||
Administrative and General |
|||||||||||||||
9 |
Northern California Division |
280,974 |
51,840 |
332,815 |
9 |
||||||||||
10 |
System Allocable |
664,403 |
664,403 |
10 |
|||||||||||
Depreciation and Amortization |
|||||||||||||||
11 |
Northern California Division |
2,687,130 |
2,687,130 |
11 |
|||||||||||
12 |
System Allocable |
207,635 |
207,635 |
12 |
|||||||||||
13 |
Taxes Other Than Income |
514,241 |
514,241 |
13 |
|||||||||||
Escalation [1] |
0 |
||||||||||||||
14 |
Labor |
97,018 |
97,018 |
14 |
|||||||||||
15 |
Other |
25,984 |
25,984 |
15 |
|||||||||||
Income Taxes |
0 |
||||||||||||||
16 |
State |
(13,680) |
331,528 |
317,848 |
16 |
||||||||||
17 |
Federal |
(15,130) |
1,196,575 |
1,181,445 |
17 |
||||||||||
18 |
Total Operating Expenses |
$ |
6,776,975 |
$ |
1,582,540 |
$ |
8,359,516 |
18 |
|||||||
19 |
Net Operating Income |
$ |
1,954,245 |
$ |
2,216,928 |
$ |
4,171,173 |
19 |
|||||||
Rate Base |
|||||||||||||||
Gas Plant in Service |
|||||||||||||||
20 |
Northern California Division |
$ |
68,815,799 |
$ |
0 |
$ |
68,815,799 |
20 |
|||||||
21 |
System Allocable |
1,987,947 |
0 |
1,987,947 |
21 |
||||||||||
22 |
Total Gross Plant |
$ |
70,803,746 |
$ |
0 |
$ |
70,803,746 |
22 |
|||||||
Accumulated Provision for |
|||||||||||||||
Depreciation and Amortization |
|||||||||||||||
23 |
Northern California Division |
$ |
17,889,666 |
$ |
0 |
$ |
17,889,666 |
23 |
|||||||
24 |
System Allocable |
1,168,895 |
0 |
1,168,895 |
24 |
||||||||||
Total Accumulated Provision for |
|||||||||||||||
25 |
Depreciation and Amortization |
$ |
19,058,561 |
$ |
0 |
$ |
19,058,561 |
25 |
|||||||
26 |
Net Plant in Service |
$ |
51,745,185 |
$ |
0 |
$ |
51,745,185 |
26 |
|||||||
Other Rate Base Items |
|||||||||||||||
27 |
Working Capital (add) |
$ |
395,392 |
$ |
0 |
$ |
395,392 |
27 |
|||||||
28 |
Customer Advances (deduct) |
155,425 |
0 |
155,425 |
28 |
||||||||||
29 |
Deferred Taxes (deduct) |
6,497,984 |
0 |
6,497,984 |
29 |
||||||||||
30 |
Total Other Rate Base Items |
$ |
(6,258,017) |
$ |
0 |
$ |
(6,258,017) |
30 |
|||||||
31 |
Total Rate Base |
$ |
45,487,168 |
$ |
0 |
$ |
45,487,168 |
31 |
|||||||
32 |
Rate of Return |
4.30% |
9.17% |
32 |
|||||||||||
(END OF APPENDIX D)
APPENDIX E
SOUTHWEST GAS CORPORATION | ||||||||||||||||||
SOUTHERN CALIFORNIA | ||||||||||||||||||
SUMMARY OF THE OVERALL RESULTS OF OPERATIONS | ||||||||||||||||||
FOR THE TWELVE MONTHS ENDED DECEMBER 31, 2003 | ||||||||||||||||||
Southwest |
||||||||||||||||||
Line |
Attrition |
Adjusted |
Line | |||||||||||||||
No. |
Description |
Reference |
Reference |
12/31/07 |
Deficiency |
12/31/07 |
No. | |||||||||||
(a) |
(b) |
(c) |
(d) |
(e) |
||||||||||||||
1 |
Operating Revenue |
$ |
91,154,600 |
$ |
8,294,226 |
$ |
99,448,826 |
1 |
||||||||||
2 |
Gas Cost |
47,741,473 |
|
47,741,473 |
2 |
|||||||||||||
3 |
Operating Margin |
$ |
43,413,127 |
$ |
8,294,226 |
$ |
51,707,353 |
3 |
||||||||||
Operating Expenses |
||||||||||||||||||
4 |
Other Gas Supply |
Ch 22D, Sh 4 |
$ |
90,026 |
$ |
$ |
90,026 |
4 |
||||||||||
5 |
Distribution |
Ch 22D, Sh 7 |
9,661,071 |
9,661,071 |
5 |
|||||||||||||
6 |
Customer Accounts |
Ch 22D, Sh 8 |
5,601,739 |
15,965 |
5,617,704 |
6 |
||||||||||||
7 |
Customer Service & Information |
Ch 22D, Sh 9 & 10 |
7,721 |
7,721 |
7 |
|||||||||||||
8 |
Sales |
Ch 22D, Sh 10 |
0 |
0 |
8 |
|||||||||||||
Administrative and General |
||||||||||||||||||
9 |
Southern California Division |
Ch 22D, Sh 12 |
520,079 |
520,079 |
9 |
|||||||||||||
10 |
System Allocable |
Ch 22D, Sh 14 |
4,584,636 |
4,584,636 |
10 |
|||||||||||||
Depreciation and Amortization |
||||||||||||||||||
11 |
Southern California Division |
Ch 22D, Sh 25 |
11,216,102 |
11,216,102 |
11 |
|||||||||||||
12 |
System Allocable |
Ch 22D, Sh 26 |
1,752,514 |
1,752,514 |
12 |
|||||||||||||
13 |
Taxes Other Than Income |
Ch 22D, Sh 16 |
2,801,779 |
110,126 |
2,911,905 |
13 |
||||||||||||
Escalation [1] |
||||||||||||||||||
14 |
Labor |
2,384,148 |
2,384,148 |
14 |
||||||||||||||
15 |
Other |
606,476 |
606,476 |
15 |
||||||||||||||
Income Taxes |
||||||||||||||||||
16 |
State |
Ch 22D, Sh 15 |
(90,145) |
722,063 |
631,918 |
16 |
||||||||||||
17 |
Federal |
Ch 22D, Sh 15 |
(391,561) |
2,606,125 |
2,214,564 |
17 |
||||||||||||
18 |
Total Operating Expenses |
$ |
38,744,584 |
$ |
3,454,279 |
$ |
42,198,863 |
18 |
||||||||||
19 |
Net Operating Income |
$ |
4,668,544 |
$ |
4,839,947 |
$ |
9,508,490 |
19 |
||||||||||
20 |
IDRB Adjustor |
972,042 |
972,042 |
20 |
||||||||||||||
21 |
Net Operating Income with IDRB Adjustor |
5,640,585 |
$ |
4,839,947 |
10,480,532 |
21 |
||||||||||||
Rate Base |
||||||||||||||||||
Gas Plant in Service |
||||||||||||||||||
22 |
Southern California Division |
Ch 22D, Sh 17 |
$ |
241,176,773 |
$ |
0 |
$ |
241,176,773 |
22 |
|||||||||
23 |
System Allocable |
Ch 22D, Sh 17 |
13,093,642 |
0 |
13,093,642 |
23 |
||||||||||||
24 |
Total Gross Plant |
$ |
254,270,414 |
$ |
0 |
$ |
254,270,414 |
24 |
||||||||||
Accumulated Provision for |
||||||||||||||||||
Depreciation and Amortization |
||||||||||||||||||
25 |
Southern California Division |
Ch 22D, Sh 17 |
$ |
123,893,532 |
$ |
0 |
$ |
123,893,532 |
25 |
|||||||||
26 |
System Allocable |
Ch 22D, Sh 17 |
11,233,216 |
0 |
11,233,216 |
26 |
||||||||||||
Total Accumulated Provision for |
||||||||||||||||||
27 |
Depreciation and Amortization |
$ |
135,126,748 |
$ |
0 |
$ |
135,126,748 |
27 |
||||||||||
28 |
Net Plant in Service |
$ |
119,143,666 |
$ |
0 |
$ |
119,143,666 |
28 |
||||||||||
Other Rate Base Items |
||||||||||||||||||
29 |
Working Capital (add) |
Ch 22D, Sh 17 |
$ |
3,836,070 |
$ |
0 |
$ |
3,836,070 |
29 |
|||||||||
30 |
Customer Advances (deduct) |
Ch 22D, Sh 17 |
653,826 |
0 |
653,826 |
30 |
||||||||||||
31 |
Deferred Taxes (deduct) |
Ch 22D, Sh 17 |
8,034,396 |
0 |
8,034,396 |
31 |
||||||||||||
32 |
Total Other Rate Base Items |
$ |
(4,852,152) |
$ |
0 |
$ |
(4,852,152) |
32 |
||||||||||
33 |
Total Rate Base |
$ |
114,291,514 |
$ |
0 |
$ |
114,291,514 |
33 |
||||||||||
34 |
Rate of Return |
4.94% |
9.17% |
34 |
||||||||||||||
|
|
|
|
|
|
|
||||||||||||
[1] Escalation amounts are located in the sheets referenced in Col. (b) of Lines 4 - 10. |
||||||||||||||||||


