Fisher's Exact Test
Fisher's Exact Test
This appendix documents Fisher's Exact Test (FET) calculation methods and presents staff's comparison of Z-test and FET results.
Calculation methods
Calculation methods and examples for percentage measures where lower values represent better performance are presented in Attachment 1. Calculation methods and examples for percentage measures where higher values represent better performance are presented in Attachment 2.
Convergence of Z-test and FET results
Staff compared Type I error values (alpha probabilities) produced by the Z-test with those produced by the FET for one "lower is better" submeasure and one "higher is better" submeasure. Staff found that the results from the two tests converge for large sample sizes. Specifically, the size of the difference between the alphas calculated for each test was highly negatively correlated with the natural log of the CLEC sample size as listed in Table 1. "Highly negatively correlated" means that as sample size increases, the difference between the Z-test alpha and the FET alpha decreases in a close and predictable relationship.
Table 1
Measure type |
Sample sizes |
N |
Correlation coefficient |
p | |
High is better |
1 to 100 |
102 |
-0.89 |
0.00 | |
High is better |
All |
204 |
-0.74 |
0.00 | |
Low is better |
All |
167 |
-0.94 |
0.00 |
The correlation for the whole sample for the "high is better" measure is artifactually smaller than for the half-sample because the difference between the alphas for the two tests reduced to zero and could not diminish further for very large sample sizes. Thus though the convergence was perfect for very large samples, since there was no variation, the correlation was zero for this part of the bivariate distribution.
Table 2 lists the extent of the differences between the alphas for the two tests and illustrates the convergence of the results as sample sizes increase.
Table 2
Measure type |
Sample sizes |
N |
Mean difference |
Median difference | |
High is better |
1 to 30 |
63 |
0.12 |
0.09 | |
31 to 100 |
39 |
0.009 |
0.00 | ||
101 + |
102 |
0.0006 |
0.00 | ||
Low is better |
1 to 100 |
102 |
0.40 |
0.44 | |
101 to 500 |
27 |
0.12 |
0.11 | ||
501 to 1500 |
21 |
0.05 |
0.06 | ||
1500 + |
17 |
0.015 |
0.02 |
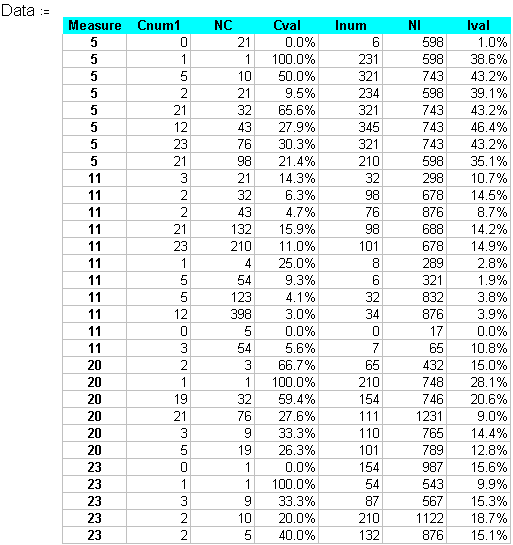
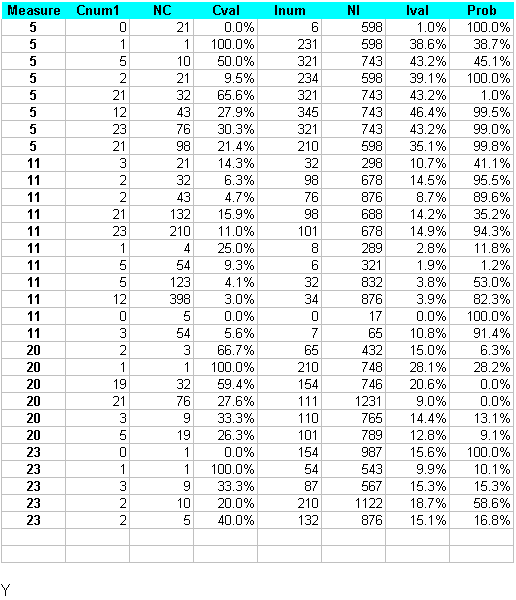
Mathcad worksheet: Hypothetical data example calculations for Fisher's Exact test. Measures for which low values represent good service.
Data :=

![]()
![]()
![]() Numerator for CLEC
Numerator for CLEC
![]() Denominator (sample size) for CLEC
Denominator (sample size) for CLEC
![]() Numerator for ILEC
Numerator for ILEC
![]() Denominator for ILEC
Denominator for ILEC
The following function calculates Fisher's exact test using the above four parameters. If the CLEC numerator (HC) is zero, the probability is 1 regardless of the other parameters
.

![]()
![]()
![]()
![]()

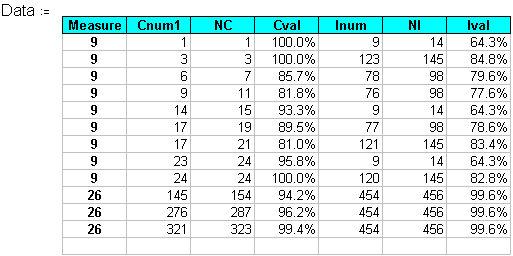
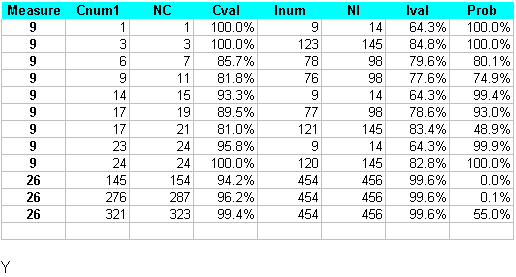
Mathcad worksheet: Hypothetical data example calculations for Fisher's Exact test. Measures for which high values represent good service.
Data :=

![]()
![]()
![]() Numerator for CLEC. This value is
Numerator for CLEC. This value is
converted from "hits" to "misses".
![]() Denominator (sample size) for CLEC
Denominator (sample size) for CLEC
![]() Numerator for ILEC, also converted
Numerator for ILEC, also converted
from "hits" to "misses."
![]() Denominator for ILEC
Denominator for ILEC
The following function calculates Fisher's exact test using the above four parameters. If the CLEC numerator (HC) is zero, the probability is 1 regardless of the other parameters.

![]()
![]()
![]()
![]()


