Beta Error
Beta Error Levels
This appendix documents staff's analyses of beta error levels for various performance. Staff prepared two analyses. The first analysis examined betas for all possible parity measures using Modified Z-test calculations for all measure types. While these are not the test applications that the Commission will implement, using these tests allows some comparisons that are otherwise difficult. These values are calculated from May 2000 performance data. The alternative hypothesis posed for all estimates was that the CLEC's results were at least 50 percent worse than the ILEC's results. The formula used is based on Hays, supra at 284-289 (1994) except that the ILEC and CLEC sample sizes are used:
t_ = (H0-Halt)/SDm
The second analysis examined beta error levels for all parity measures as implemented by the Commission in this decision with the exception that log transformations were not performed. These values are calculated from July through September, 2000 performance data. The above formula was used for the average-based parity measures. Pacific's Dr. Gleason calculated the betas for the percentage and rate measures using the hypergeometric and binomial distributions, respectively.
Table 1 lists beta values calculated from Pacific's May, 2000 performance data as described above. Calculations are presented for four different critical alpha levels and for two alternative hypotheses. The alternative hypotheses represents performance provided to CLECs that is 50 percent worse (150%) and 100 percent worse (200%) than performance the ILEC provides itself. For example, the mean beta value for a critical alpha level of 0.10, given an alternative hypothesis of 50 percent worse performance, is 0.63. This should be interpreted as: If we keep Type I error to a maximum of 10 percent (_crit = 0.10), on average we will experience a 63-percent error rate when trying to detect performance for the CLEC that is at least 50 percent worse than performance for the ILEC.
Table 1
Average Beta values for Pacific May, 2000, parity measures | ||||||
Alternative hypothesis |
||||||
150% |
200% |
|||||
Critical _ |
Mean |
Median |
Mean |
Median | ||
0.05 |
0.70 |
0.88 |
0.58 |
0.77 | ||
0.10 |
0.63 |
0.79 |
0.51 |
0.64 | ||
0.15 |
0.57 |
0.72 |
0.45 |
0.55 | ||
0.20 |
0.52 |
0.65 |
0.40 |
0.47 | ||
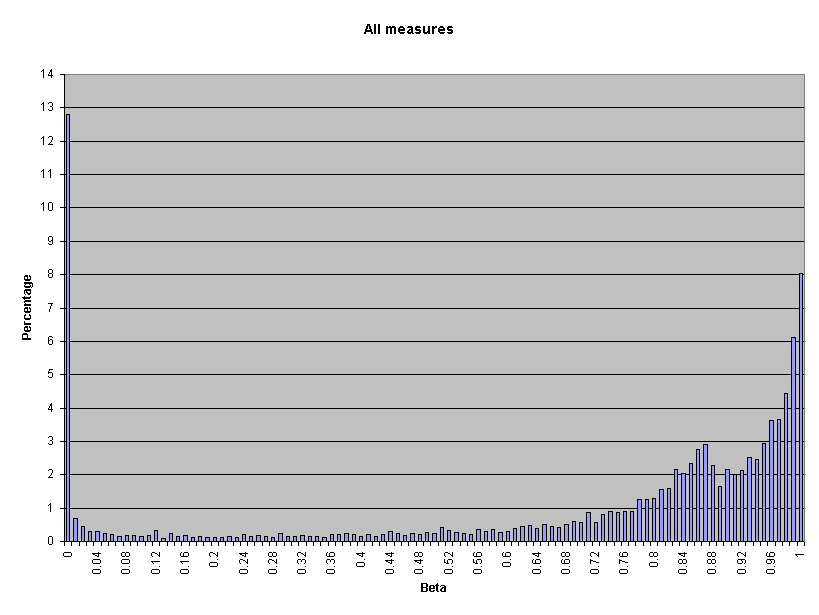
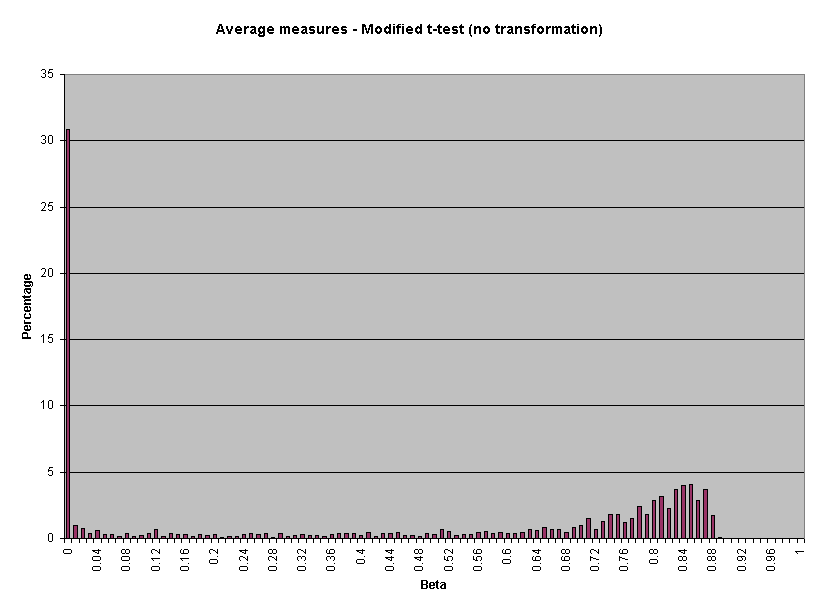
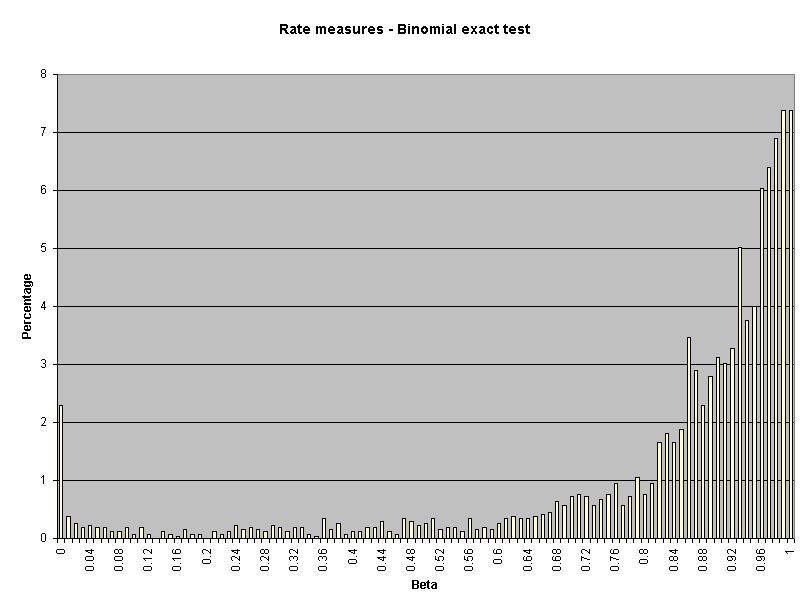
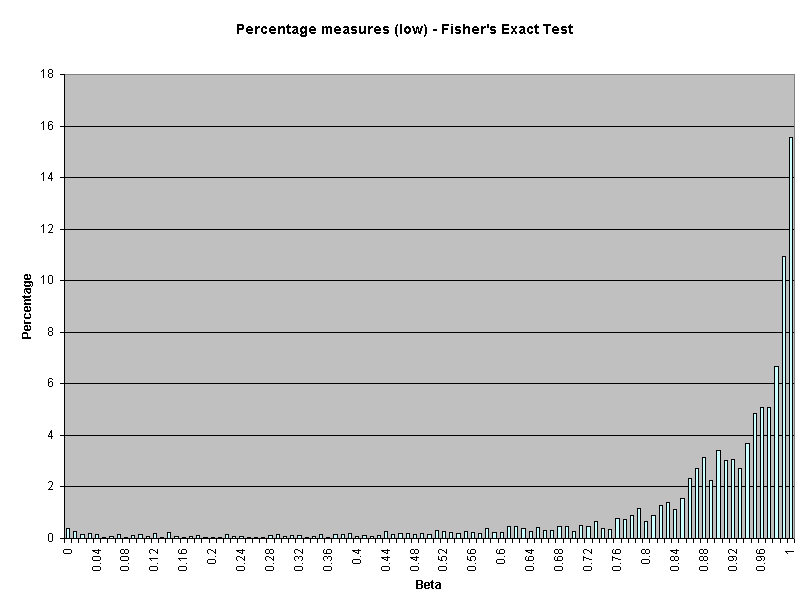
Table 2 presents beta values for parity measures by measurement type for Pacific's performance in July through September, 2000. All beta calculations are based on a 0.10 critical alpha and an alternative hypothesis of 50 percent worse performance (150%) for CLECs.
Table 2
Average beta value by parity test type - Pacific performance July through August, 2000 | |||||
All |
Average |
Percent (Hi) |
Percent (Lo) |
Rate | |
N |
9909 |
2768 |
928 |
3558 |
2655 |
Percentage |
100% |
28% |
9% |
36% |
27% |
Mean |
0.70 |
0.45 |
0.42 |
0.87 |
0.83 |
Median |
0.85 |
0.58 |
0.36 |
0.94 |
0.92 |
SD |
0.35 |
0.37 |
0.41 |
0.20 |
0.24 |
Skewness |
-1.15 |
-0.20 |
0.18 |
-2.52 |
-2.18 |
Kurtosis |
-0.24 |
-1.76 |
-1.75 |
6.58 |
4.16 |
Minimum |
0.00 |
0.00 |
0.00 |
0.00 |
0.00 |
Maximum |
1.00 |
0.89 |
1.00 |
1.00 |
1.00 |
Attachment 1 presents the beta value cumulative distribution for all parity measures as presented in Table 2. For example, about 16 percent of all CLEC submeasure parity test results have beta values of 0.10 or less. In other words, when Type I error rate is held to 0.10 or less for all results, only 16 percent of all parity test results will have a Type II error rate of 0.10 or less.
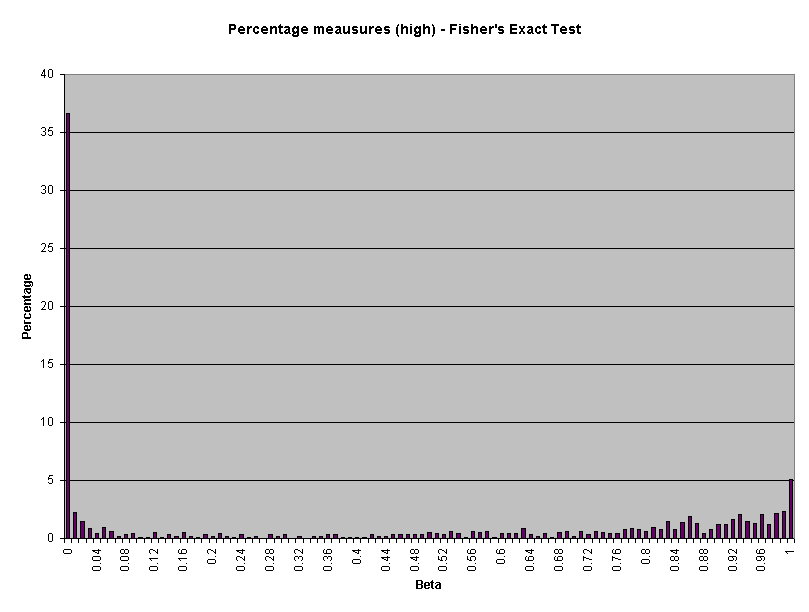
Attachment 2 presents the beta value frequency distributions for all parity measures combined and each measure type as presented in Table 2. For example, for all parity measures, two percent of beta values equal 0.84 (page 1).