Application output data is written to a text file containing two columns; one lists days 1 through 180, the other shows the sum total of payments collected for each day.
COLLECTIONS CURVE
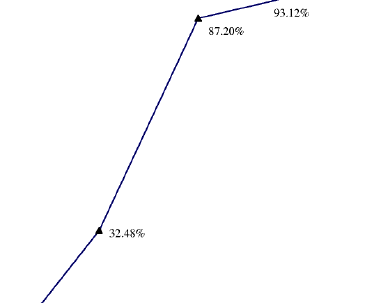
The Collections Curve plots data points at each of six 30-day intervals. For each day during the collection cycle, the total of daily revenue collections associated with bills issued to customers in the sample size is tabulated. In the sample population, a discrepancy was observed between the level of collections at the conclusion of the 180-day period and the expected level of collections that would result according to the Commission-approved uncollectibles factor. To address this discrepancy, the difference between expected and observed collections has been uniformly distributed over the 180 day period. To reflect PG&E's serial billing process, the percent of the amount billed is divided by 30 to simulate a daily average collection performance.
ANNEX A TO ATTACHMENT B Pacific Gas and Electric Company Collections Curve Description May 2, 2001
Day |
Collections Percentage |
Net |
0 |
0.00% |
|
30 |
32.48% |
32.48% |
60 |
87.20% |
54.72% |
90 |
93.12% |
5.92% |
120 |
95.55% |
2.44% |
150 |
97.92% |
2.37% |
180 |
99.73% |
1.81 |
Pacific Gas and Electric Company Composite Collections Curve
100.00%
99.73%
v r,a~ O U C
C v
90.00% -
80.00% -
70.00% -
60.00% -
50.00% -
40.00% -
30.00% -
20.00% -
0 30 All Retail Customer Classes
3/26/01 data extract for billing month of Jul-00
60
95.55%
90 120 150 180 Days
97.92%


