A DEVELOPMENT OF BASELINE AND ENERGY EFFICIENCY DATA
This appendix describes the baseline and energy efficiency measure data used in the study. The remaining appendices contain a complete listing of the data used in our modeling process.
A.1 BASELINE DATA
The principal baseline data used in this study consist of end use and technology specific data as well as economic data (avoided costs and commercial rates).
A.1.1 End Use and Technology Specific Data
Estimating the potential for energy-efficiency improvements requires a comparison of the energy impacts of existing, standard-efficiency technologies with those of alternative high-efficiency equipment. This, in turn, dictates a relatively detailed understanding of the statewide energy characteristics of the existing marketplace. Data that were required at the utility service area and building type level included:
· Annual energy consumption per square foot for each end use studied;
· End use load shapes and energy/peak factors;
· Electric end use saturation, and
· Technology share for each base technology in scope.
Sources for and development of each of these key data elements are discussed in the following subsections.
End Use Energy Consumption
The primary source used for end use energy consumption is the CEC commercial end use forecasting database. In the end use forecasting approach, end use energy consumption is expressed as the product of building floorspace (in square feet), the fraction of floorspace associated with a given end use (the end use saturation), and EUI (the energy use intensity of an end use, expressed in kWh per square foot). These three data elements have been collected and estimated from various sources over time and form the foundation upon which the CEC energy demand forecasts are developed.
Figure A-1 summarizes commercial energy usage by building type. In 2000, commercial energy usage for the three major California electric utilities was about 80,000 GWh. Office buildings accounted for about 34% of this usage, or about 23,000 GWh. The next largest energy consuming building types were food stores, hospital/health facilities, and miscellaneous buildings, each accounting for about 12% of commercial usage, or about 10,000 GWh.
Figure A-1
Commercial Energy Usage by Building Type
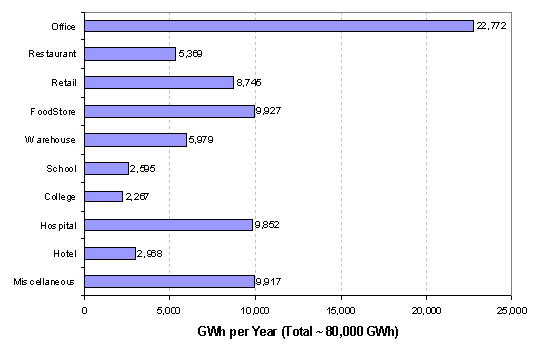
Source: CEC 2000. California Energy Demand: 2000-2010.
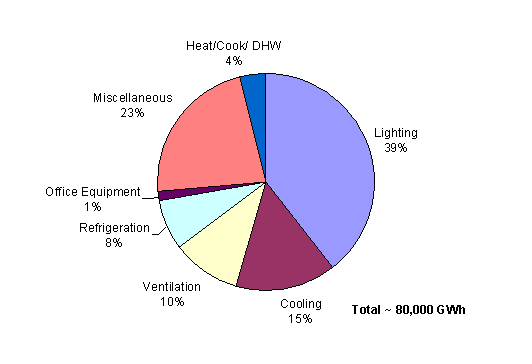
Figure A-2 summarizes the CEC's estimates of commercial energy use by end use. We made a small number of changes in some of the CEC's estimates, where we believed that energy use had been significantly underestimated. For lighting and cooling, we made changes when the equivalent full-load hours implied by the EUIs were judged to be unreasonable. We also changed some office equipment estimates. While the CEC forecast data show the office equipment end use accounting for only 1% of commercial consumption, it is likely that a portion of "miscellaneous" consumption is also attributable to office equipment. The office equipment usage figure was adjusted upward to about 3% of total consumption, based on data developed from the PG&E CEUS. The final end use breakdown resulting from our baseline estimates is shown in Figure A-3. Lighting remains the most predominant end use, accounting for 39% of total consumption or about 31,000 GWh. Cooling, ventilation, and refrigeration are the next largest end uses, accounting for about 15%, 11%, and 8% of total consumption respectively. Our final EUIs are shown, by technology, in Appendix C.
To determine measure costs and cost-effectiveness, we also need estimates of the number of technology units per square foot of floorspace, i.e., lighting fixtures, cooling tons, ventilation horsepower, etc. per square foot. These estimates are derived by first dividing our EUIs (kWh/square foot) by estimates of full-load equivalent hours, which results in kW/square foot. We then estimate kW/unit and then divide by kW/square foot to arrive at units per square foot. Our estimates of units per square foot are provided in Appendix C. Our underlying full-load equivalent hours for lighting and cooling are shown in Table A-1.
Figure A-2
CEC Commercial Energy Usage Breakdown by End Use for Major IOUs
Source: CEC 2000. California Energy Demand: 2000-2010.
Figure A-3
Commercial End Use Breakdown for this Study

Source: CEC 2000. California Energy Demand: 2000-2010.
Table A-1
Implicit Full-Load Equivalent Hours
|
Cooling |
Indoor Lighting | ||||
Building Type |
PG&E |
SCE |
SDG&E |
PG&E |
SCE |
SDG&E |
Office |
1,113 |
1,508 |
1,225 |
4,926 |
4,358 |
4,469 |
Restaurant |
1,292 |
1,643 |
1,420 |
2,935 |
2,847 |
3,133 |
Retail |
850 |
1,212 |
901 |
3,068 |
3,113 |
3,332 |
FoodStore |
1,672 |
2,049 |
1,801 |
6,658 |
6,055 |
6,564 |
Warehouse |
515 |
687 |
558 |
1,857 |
3,212 |
3,354 |
School |
677 |
706 |
739 |
1,875 |
2,045 |
2,208 |
College |
682 |
910 |
770 |
2,027 |
2,158 |
2,214 |
Hospital |
1,847 |
2,210 |
2,062 |
6,213 |
5,999 |
5,900 |
Hotel |
928 |
1,150 |
1,034 |
2,589 |
2,666 |
2,919 |
Miscellaneous |
1,635 |
1,875 |
1,822 |
1,486 |
1,951 |
2,885 |
Load shapes and Energy / Peak ("H") Factors
Load shape data was used to develop energy and peak factors. Energy and peak factors are used to allocate annual energy usage into utility costing periods and to provide estimates of peak demand based on cost period energy usage. The factors were developed by California IOU service area, end-use, and building type and were used to allocate measure impacts to utility costing periods for purposes of estimating avoided-cost benefits. The energy and peak factors are sometimes referred to as "H" factors.
In the case of the electric energy factors, these factors are computed based on predefined costing periods (e.g., season, day of the week, and hours of the day) divided by annual energy use. The end result is a series of values for each period such that the sum of the periods is equal to one.
The peak factors are based on the same predefined periods as the energy factors. In this case, the peak demand within a cost period is divided by the average demand within that same period; that is, the peak factor is the ratio of peak to average demand in a period. This is done for both noncoincident demands as well as for coincident demands. In the case of coincident demands, the time of coincidence was set to be the time at which the California electric system typically peaked within each marginal costing period.
Data Sources for Load shape and TOU Analysis
The data used to develop the load shape/time-of-use factors for SDG&E were obtained from a SDG&E EUI study performed by RER, Inc. in 2000. The data used in the EUI study originated from the following research efforts performed by SDG&E:
· 1995 Nonresidential New Construction Database,
· 1996 Nonresidential New Construction Database,
· 1995 Title 24 Plus Measurement & Evaluation Survey Database, and
· 1998 Measurement & Evaluation Survey Database.
The new construction databases for 1995 and 1996 were fielded to determine first-year load impacts from SDG&E's new construction program. Over 650 sites were surveyed for this effort. The other databases, listed above, were obtained from SDG&E's Measurement and Evaluation CEUS in both 1995 and 1998 where over 1,000 surveys were fielded. These data were collected using on-site surveyors subcontracted by SDG&E. RER's survey analysis tool, SITEPRO, was used to evaluate these data and develop the load profiles used in the current study.
The data used to develop the load shape/time-of-use factors for PG&E were obtained from the PG&E 1998 Commercial Building Survey Project. The Commercial Building Survey was a data collection effort involving an on-site survey of almost 1,000 commercial customers chosen to represent the population of commercial buildings in the PG&E service territory. This survey collected information about customers' building structures, business operations, equipment types, fuel choices, and operating schedules. This information, along with billing data and other available customer information, was further analyzed to produce simulated end-use intensities and simulated hourly end-use consumption. Data in this report were collected during the calendar years 1996 and 1997.
Because no comparable data were available for SCE, a combination of data sources was used. SDG&E factors were utilized for the non-cooling end uses. For the cooling end use, SCE commercial load research data were utilized for the office, restaurant, retail, grocery, warehouse, and hospital/health building types, and SDG&E factors were utilized for the school, college, hotel, and miscellaneous building type.
TOU Energy Factors
With the load shapes from the studies described above, representative electric rates were identified that represented typical marginal cost time-of-use (TOU) periods. To determine these periods, the "ALTOU" rate and the "A-6" rate were used for SDG&E and PG&E respectively. These tariffs are considered general service TOU rates for small businesses. They were chosen to be representative of the standard time-of-use schedules found throughout most of the tariffs offered by the utilities to their customers. The energy factors were calculated using this TOU information by applying it to the existing load shape data.
TOU Peak Factors
Determining the coincident peak times was accomplished by examining system-wide load data made available from California ISO for the entire state of California. Load data for the year 2000 was summarized by weekday and weekend. A graphical analysis was performed to identify peak times by month and daytype. The following months, daytypes, and hours were determined to represent the coincident peak for each of six TOU periods. There are differences between SDG&E and PG&E's coincident peak hours. This is due to the differences in their TOU period definitions. The peak hours for each TOU period are listed below.
Table A-2
Peak Hours for Each TOU Period
Utility |
Season |
TOU Period |
Month |
Daytype |
Hour |
SDG&E |
Winter |
Off-peak |
January |
Coldest |
2300 |
Semi-peak |
January |
Coldest |
1100 | ||
On-peak |
January |
Coldest |
1800 | ||
Summer |
Off-peak |
August |
Hottest |
1100 | |
Semi-peak |
August |
Hottest |
1900 | ||
On-peak |
August |
Hottest |
1600 | ||
PG&E |
Winter |
Semi-peak |
January |
Coldest |
0800 |
On-peak |
January |
Coldest |
1800 | ||
Summer |
Off-peak |
August |
Hottest |
2200 | |
Semi-peak |
August |
Hottest |
1200 | ||
On-peak |
August |
Hottest |
1600 |
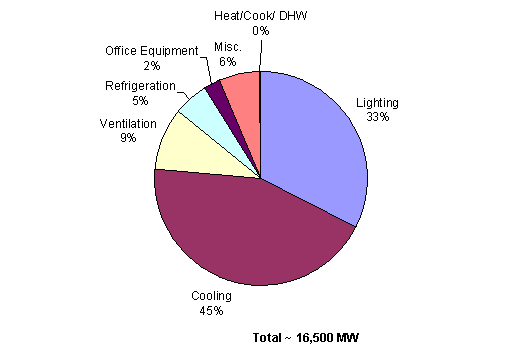
An example of the electric energy and peak factors that were developed is shown in Table A-3 (all factors are provided in Appendix A). By combining these factors with annual end use energy consumption figures, estimates of commercial peak demand can be developed for each end use. Figure A-4 shows the end use allocation of peak demand developed for this study.
Table A-3
Example of Electric Energy Factors - Offices by End-Use
End Use |
Season |
TOU Period |
Energy Factor |
Peak Factor |
Coin. Peak Factor |
Cool |
Winter |
Off-Peak |
0.0438 |
58.5310 |
1.0891 |
Cool |
Winter |
Semi-Peak |
0.1324 |
8.3020 |
0.1042 |
Cool |
Summer |
Off-Peak |
0.2107 |
12.1411 |
1.8877 |
Cool |
Summer |
Semi-Peak |
0.2382 |
3.2244 |
3.0486 |
Cool |
Summer |
Peak |
0.3750 |
1.9281 |
1.9281 |
Interior Light |
Winter |
Off-Peak |
0.1719 |
4.2817 |
2.7480 |
Interior Light |
Winter |
Semi-Peak |
0.3307 |
1.3183 |
0.8008 |
Interior Light |
Summer |
Off-Peak |
0.1655 |
4.1998 |
0.8876 |
Interior Light |
Summer |
Semi-Peak |
0.1578 |
1.4526 |
1.4150 |
Interior Light |
Summer |
Peak |
0.1742 |
1.1125 |
1.0481 |
Misc |
Winter |
Off-Peak |
0.2796 |
1.8211 |
1.3033 |
Misc |
Winter |
Semi-Peak |
0.2344 |
1.2870 |
0.9392 |
Misc |
Summer |
Off-Peak |
0.2572 |
1.7549 |
0.9262 |
Misc |
Summer |
Semi-Peak |
0.1146 |
1.2957 |
1.1979 |
Misc |
Summer |
Peak |
0.1143 |
1.1161 |
1.0204 |
Office Equip |
Winter |
Off-Peak |
0.2556 |
1.9983 |
1.5072 |
Office Equip |
Winter |
Semi-Peak |
0.2483 |
1.2186 |
0.9134 |
Office Equip |
Summer |
Off-Peak |
0.2473 |
1.9275 |
0.9774 |
Office Equip |
Summer |
Semi-Peak |
0.1239 |
1.2682 |
1.2299 |
Office Equip |
Summer |
Peak |
0.1248 |
1.0713 |
1.0302 |
Figure A-4
Estimated Commercial Peak Demand for Major IOUs
Breakdown by End Use
Baseline Technology Shares (Applicability Factors)
The technology or equipment mix within an end use determines the applicability of energy efficiency measures for that end use. For example, high-efficiency DX air conditioning measures are only applicable to the portion of the space cooling end use that is served by DX air conditioning (as opposed to other air conditioning equipment such as chillers). Data on technology shares were developed from several sources, as summarized in Table A-4. A brief discussion of sources and development of technology share data follows.
Table A-4
Data Sources for Technology Shares
End Use |
Data Source |
Indoor Lighting |
PG&E CEUS, SCE CEUS, SDG&E CEUS |
Outdoor Lighting |
PG&E CEUS, SCE CEUS, SDG&E CEUS |
Space Cooling |
PG&E CEUS, SCE CEUS, SDG&E CEUS |
Ventilation |
PG&E CEUS applied to all three utilities |
Refrigeration |
LBNL Commercial Refrigeration Report (LBL-37397) |
Office Equipment |
LBNL Office Equipment Study (LBNL-45917) |
The data sources listed in Table 4-5 are summarized below:
· The PG&E Commercial End Use Survey (CEUS). Data from this survey were collected during calendar years 1996 and 1997 via on-site surveys. A total of 983 buildings were included in the sample. XENERGY analyzed the CEUS data directly to estimate technology shares.
· The SCE CEUS. Data from this survey were collected via on-site surveys in two waves, based on building type. Data for offices, retail stores, food stores, restaurants, and warehouses were collected in 1992. Data for schools, colleges, hospitals/health facilities, lodging, and miscellaneous buildings were collected in 1995. A total of 700 surveys were conducted in 1992, and 500 surveys were conducted in 1995. ADM Associates provided analysis of SCE CEUS data.
· SDG&E CEUS: This was a survey of 350 commercial buildings in the SDG&E service territory. Data were collected via on-site surveys during 1998. Extensive technology detail on lighting and HVAC systems was available. RER analyzed the data to provide technology share inputs.
· LBNL commercial refrigeration study. This study provides detailed specification of commercial refrigeration systems as well as methods for estimating savings for efficient refrigeration measures. Modeling procedures and methods used in this study rely, where possible, on the inputs and assumptions contained in the LBL report. In addition, PG&E program application filings were mined for individual measure algorithms, and, where necessary, some algorithms were developed independently for this study. Refer to appendices J and K for baseline modeling and measure modeling, respectively.
· LBNL office equipment study. In this study Lawrence Berkeley National Laboratories utilized secondary source data to estimate office equipment electricity consumption by sector (residential, commercial, and industrial) and equipment type. Estimates were made for calendar year 1999.
Indoor and Outdoor Lighting
Indoor and outdoor lighting technology shares were developed using a six-step process. For the analysis, it was assumed that lighting intensity (lumens per square foot) remained relatively constant for a given building type, regardless of the type of equipment used for lighting. The six steps of the analysis process were as follows:
1. Tabulate lamp counts by fixture type and business type for CEUS and SDG&E survey data;
2. Translate lamp counts into fixture counts based on lamps per fixture;
3. Identify lighting output (lumens) for each fixture type;
4. Translate fixture counts into estimates of lighting output for each fixture type;
5. Aggregate detailed fixture types into a reduced set of prototypical fixture types; and
6. Calculated technology shares as the fraction of lighting output accounted for by the aggregate fixture type.
Table 4-6 summarizes lighting equipment shares developed for each utility. Shares by utility and building type are shown in Appendix C under the Applicability table.
Review of PG&E and SCE CEUS data revealed that lighting equipment shares for small customers were not appreciably different from the average. Thus, the average shares shown in Table A-5 were used for the small customer potential analysis.
Table A-5
Lighting Technology Shares for Reduced Set of Prototypical Fixtures
|
Technology Shares | ||
Base Equipment Type |
PG&E |
SCE |
SDG&E |
Indoor Lighting |
|
|
|
4-lamp, 4-foot fluorescent |
32% |
30% |
25% |
2-lamp, 4-foot fluorescent |
40% |
31% |
33% |
2-lamp, 8-foot fluorescent |
17% |
30% |
9% |
75W Incandescent |
4% |
3% |
2% |
150W Incandescent |
1% |
1% |
11% |
Other indoor |
7% |
5% |
19% |
Indoor Total |
100% |
100% |
100% |
Outdoor Lighting |
|||
2-lamp, 4-foot fluorescent |
15% |
18% |
7% |
400W mercury vapor |
83% |
82% |
90% |
Other outdoor |
2% |
0% |
4% |
Outdoor Total |
100% |
100% |
100% |
Space Cooling
The key technology distinction in this study for the space cooling end use was between DX (direct expansion) air conditioning units and central chillers. Technology shares were developed by building type and were based on installed cooling tons. Table A-6 summarizes technology shares by utility. Shares by utility and building type are shown in Appendix C under the Applicability table.
Table A-6
Space Cooling Technology Shares
|
Technology Shares | ||
Base Equipment Type |
PG&E |
SCE |
SDG&E |
DX air conditioning |
49% |
67% |
79% |
Chillers |
50% |
33% |
21% |
Total |
100% |
100% |
100% |
For small customers, review of PG&E and SCE CEUS data revealed that space cooling was provided almost exclusively by DX systems. Thus, the DX equipment shares were set to 100% for the small customer potential analysis.
Ventilation
The technology distinction for ventilation was fan motor size. Using PG&E CEUS data, fans were grouped into four different size categories based on fan horsepower. Each category was then modeled using a prototypical fan size. (Motor sizes under 1hp were not analyzed.) Size shares were calculated as the percent of total fan horsepower that falls into each category. Table A-7 shows the ventilation-fan size distribution across all commercial building types. Shares by utility and building type are shown in Appendix C under the Applicability table.
Table A-7
Ventilation Fan Size Shares
Fan Size Range |
Representative |
Share |
Under 1hp |
none |
14% |
1hp to 10 hp |
5hp |
31% |
10+hp to 30 hp |
15hp |
18% |
Over 30hp |
40hp |
37% |
Total |
100% |
Refrigeration
All grocery stores were assumed to have a central refrigeration system. The mix of loads in the prototypical store were developed from the LBNL refrigeration study.
Office Equipment
Four types of office equipment were addressed in this study: personal computers (PCs), PC monitors, copiers, and laser printers. Together, these four equipment categories account for about 60% of commercial office equipment energy consumption. Overall office equipment shares for these four categories were developed from office equipment energy usage estimates developed at the national level by LBNL. Figure A-5 shows the technology shares of the four studied technologies (in lighter shading) along with technology shares of other key office equipment that was not addressed in this study. Variation in technology shares across building type was estimated using data on office equipment from the PG&E CEUS.
Figure A-5
Office Equipment Technology Shares
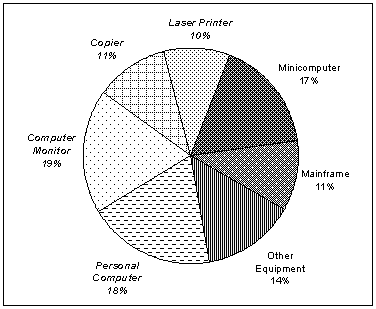
Source: Wawamoto, Kaoru, J. Koomey, B. Nordman, R. Brown, M.A. Piette, M. Ting, A. Meier, Electricity Used by Office Equipment and Network Equipment in the U.S., LBNL, February 2001.
A.1.2 Energy Cost Data
This subsection outlines the basis for assumptions for avoided costs and commercial rates. Additional discussion and references are provided in Section 2.
Avoided Cost
As discussed in Section 2, the base run avoided cost forecast was taken from the avoided cost forecasts used by the utilities in their PY2001 energy efficiency program applications. These forecasted values were required and approved by the CPUC. The values were derived by the utilities by applying the CPUC-required on-peak multipliers to avoided cost forecasts developed prior to the California energy crisis. These multipliers were ordered by the CPUC in Fall 2000 to account for the skyrocketing market clearing prices observed in Summer 2000. The basis for the multipliers was a study conducted by JBS Energy Inc on behalf of the Utility Reform Network (TURN) in September 2000. Continued use of these multipliers has been required as part of the CPUC's energy efficiency policy rules for PY2002.
The Low scenario avoided costs are half of the Base scenario avoided costs throughout the forecast period. The High scenario avoided costs are 25 percent above the Base avoided costs throughout the forecast period. The avoided cost data are provided in Appendix B.
Electricity Rates
The Base run commercial rate forecast used in this study was described in Section 2 (Table 2-1 and Figure 2-3). Current rates are roughly 70 percent higher in the summer and 40 percent higher in the winter than the frozen tariffs in place between 1998 and the first half of 2001. Our Base run commercial rate forecast starts out at current levels and then declines to values equivalent to levels the pre-energy crisis rates would have achieved by 2006 if they had increased by inflation. This rate forecast was based on and is fairly similar to that included in the CEC's October draft of their California Energy Outlook 2002-2012 report. The Low scenario commercial rates are set at 1998 frozen levels, and then increase from 2001 by 3 percent per year to account for inflation. In the High scenario, current commercial rates continue to rise throughout the forecast period. The electric rate data are provided in Appendix B.
A.2 ENERGY EFFICIENCY MEASURE DATA
This subsection presents information on the energy efficiency measures included in the study. Cost and savings fraction sources are listed and measure descriptions are provided.
A.2.1 Measures Included
The set of measures included in this potential study is shown in Table A-8 below. In reviewing this list, readers should be aware of the following:
· Measures are generally organized around base case technologies. These base case technologies are intentional aggregations of the wide variety of actual base case technologies in the market. Thus, the measure list for the potential study is not as detailed as measure lists that are necessary for actual program implementation.
¬ For example, we use the three most common fluorescent fixtures (4-foot, 4-lamp; 4-foot, 2-lamp; and 8-foot, 2-lamp to represent the base case energy for fluorescent lighting. The square footage and base case energy for other types of fluorescent systems are mapped into one of these three types.
· The measures shown in the tables were selected by starting with the DEER 2001 Update Study, with some aggregation to prototypical applications. We then reviewed utility PY2001 filings and program documentation and added measures that could have significant potential but were not on the DEER list.
Table A-8
Commercial Study Measure List
(ROB = Replace-on-Burnout, RET = Retrofit)
End Use |
Measure # |
Measure Name |
Indoor Lighting |
110 |
Base Fluorescent Fixture, 4L4'T12, 34W, 2EEMAG |
Indoor Lighting |
111 |
ROB 4L4'T8, 1EB |
Indoor Lighting |
112 |
ROB 2L4'T8, 1EB, Reflector |
Indoor Lighting |
114 |
RET 4L4'T8, 1EB |
Indoor Lighting |
115 |
RET 2L4'T8, 1EB, Reflector |
Indoor Lighting |
117 |
Occupancy Sensor, 4L4' Fluorescent Fixtures |
Indoor Lighting |
118 |
Continuous Dimming, 5L4' Fluorescent Fixtures |
Indoor Lighting |
119 |
RNV 2L4'T5HO, 1EB |
Indoor Lighting |
130 |
Base Fluorescent Fixture, 2L4'T12, 34W, 1EEMAG |
Indoor Lighting |
131 |
ROB 2L4'T8, 1EB |
Indoor Lighting |
133 |
RET 2L4'T8, 1EB |
Indoor Lighting |
134 |
RET 1L4'T8, 1EB, Reflector OEM |
Indoor Lighting |
136 |
Occupancy Sensor, 8L4' Fluorescent Fixtures |
Indoor Lighting |
137 |
Continuous Dimming, 10L4' Fluorescent Fixtures |
Indoor Lighting |
138 |
RNV 1L4'T5HO, 1EB |
Indoor Lighting |
150 |
Base Fluorescent Fixture, 2L8'T12, 60W, 1EEMAG |
Indoor Lighting |
151 |
ROB 2L8'T12, 60W, 1EB |
Indoor Lighting |
152 |
ROB 1L8'T12, 60W, 1EB, Reflector |
Indoor Lighting |
153 |
RET 2L8'T12, 60W, 1EB |
Indoor Lighting |
154 |
RET 1L8'T12, 60W, 1EB, Reflector |
Indoor Lighting |
155 |
Occupancy Sensor, 4L8' Fluorescent Fixtures |
Indoor Lighting |
156 |
Continuous Dimming, 5L8' Fluorescent Fixtures |
Indoor Lighting |
165 |
Base Incandescent Flood, 75W |
Indoor Lighting |
166 |
CFL Screw-in, Modular 18W |
Indoor Lighting |
175 |
Base Incandescent Flood, 150W PAR |
Indoor Lighting |
176 |
Halogen PAR Flood, 90W |
Indoor Lighting |
177 |
Metal Halide, 50W |
Outdoor Lighting |
210 |
Base Fluorescent Fixture, 2L4'T12, 34W, 1EEMAG |
Outdoor Lighting |
211 |
RET 2L4'T8, 1EB |
Outdoor Lighting |
212 |
Outdoor Lighting Controls (Photocell/Timeclock) |
Outdoor Lighting |
220 |
Base Mercury Vapor 400W Lamp |
Outdoor Lighting |
221 |
High Pressure Sodium 250W Lamp |
Outdoor Lighting |
222 |
Outdoor Lighting Controls (Photocell/Timeclock) |
Space Cooling |
300 |
Centrifugal Chiller, 0.58 kW/ton, 500 tons |
Space Cooling |
301 |
Centrifugal Chiller, 0.51 kW/ton, 500 tons |
Space Cooling |
302 |
Window Film (Standard) |
Space Cooling |
303 |
EMS - Chiller |
Space Cooling |
304 |
Cool Roof - Chiller |
Space Cooling |
305 |
Chiller Tune Up/Diagnostics |
Space Cooling |
306 |
Cooling Circ. Pumps - VSD |
Space Cooling |
310 |
DX Packaged System, EER=10.3, 10 tons |
Space Cooling |
311 |
DX Tune Up/ Advanced Diagnostics |
Space Cooling |
312 |
DX Packaged System, EER=10.9, 10 tons |
Space Cooling |
313 |
Window Film (Standard) |
Space Cooling |
314 |
Evaporative Pre-Cooler |
Space Cooling |
315 |
Prog. Thermostat - DX |
Space Cooling |
316 |
Cool Roof - DX |
Ventilation |
400 |
Base Fan Motor, 5hp, 1800rpm, 87.5% |
Ventilation |
401 |
Fan Motor, 5hp, 1800rpm, 89.5% |
Ventilation |
402 |
Variable Speed Drive Control, 5 HP |
Ventilation |
410 |
Base Fan Motor, 15hp, 1800rpm, 91.0% |
Ventilation |
411 |
Fan Motor, 15hp, 1800rpm, 92.4% |
Ventilation |
412 |
Variable Speed Drive Control, 15 HP |
Ventilation |
420 |
Base Fan Motor, 40hp, 1800rpm, 93.0% |
Ventilation |
421 |
Fan Motor, 40hp, 1800rpm, 94.1% |
Ventilation |
422 |
Variable Speed Drive Control, 40 HP |
Ventilation |
500 |
Base Refrigeration System |
Refrigeration |
501 |
High-efficiency fan motors |
Refrigeration |
502 |
Strip curtains for walk-ins |
Refrigeration |
503 |
Night covers for display cases |
Refrigeration |
504 |
Evaporator fan controller for MT walk-ins |
Refrigeration |
505 |
Efficient compressor motor retrofit |
Refrigeration |
506 |
Compressor VSD retrofit |
Refrigeration |
507 |
Floating head pressure controls |
Refrigeration |
508 |
Refrigeration Commissioning |
Refrigeration |
509 |
Demand Hot Gas Defrost |
Refrigeration |
510 |
Demand Defrost Electric |
Refrigeration |
511 |
Anti-sweat (humidistat) controls |
Office Equipment |
610 |
Desktop PC - Base |
Office Equipment |
611 |
Power Management Enabling |
Office Equipment |
620 |
Display Monitor |
Office Equipment |
621 |
Purchase LCD monitor |
Office Equipment |
622 |
Power Management Enabling |
Office Equipment |
623 |
Network Power Management Enabling |
Office Equipment |
624 |
External hardware control |
Office Equipment |
630 |
Copier |
Office Equipment |
631 |
Power Management Enabling |
Office Equipment |
640 |
Laser Printer |
Office Equipment |
641 |
External hardware control |
Office Equipment |
642 |
Nighttime shutdown |
A.2.2 Measure Cost and Savings Sources
Most of the measure cost data for this study were developed as part of the DEER 2001 Update study. Part of that study involved collection and analysis of residential and commercial measure cost data. Measure savings were developed from a variety of sources, including: standard engineering calculations, the CCIG Technology Energy Savings Study (NEOS, May 1994), a comprehensive LBNL refrigeration study, and recent utility program filings. All measure cost and savings estimates are shown in Appendix C.
A.2.3 Existing Energy-Efficient Measure Saturations
In order to assess the amount of energy efficiency savings available, estimates of the current saturation of energy efficient measures were developed from available data sources. In some cases, judgmental adjustments to these saturation estimates were required to bring them up to date because the available sources were several years old. Development of measure saturation data is discussed next, by end use.
Indoor and Outdoor Lighting
The saturations of efficient lighting equipment (T8s fixtures with electronic ballast, CFLs, and HID lighting) were initially developed from the PG&E CEUS and the SDG&E evaluation survey databases. For SCE, because half of the SCE CEUS was from 1992, the PG&E data were used.1 The saturations were adjusted upward to account for naturally occurring and program-influenced installations of efficient lighting equipment that occurred in the years since the initial data were collected. Table A-9 summarizes the key efficient lighting saturations, which also vary by utility and building type (with additional data provided in Appendix C). Both the initial saturation and the adjusted final saturations are presented. No adjustment was made to outdoor lighting saturations, because initial evidence of program activity showed much lower activity levels in this end use.
Table A-9
Summary of Efficient Lighting Equipment Saturations
|
|
Saturation | ||
End Use |
Equipment Type |
Initial |
Final |
Small - Final |
Indoor Lighting |
4 Foot T8 |
0.371 |
0.552 |
0.250 |
|
8 Foot T8 |
0.126 |
0.336 |
0.112 |
|
CFLs |
0.189 |
0.593 |
0.407 |
|
HIDs |
0.372 |
0.424 |
0.219 |
Outdoor Lighting |
T8s |
0.185 |
0.185 |
0.054 |
|
HIDs |
0.830 |
0.830 |
0.756 |
Table 4-9 also shows the saturations of efficient lighting equipment for small customers. These saturations were based on differences between small customers and all commercial customers developed from the PG&E CEUS.
Saturations of indoor occupancy sensors and outdoor lighting controls were developed from the PG&E CEUS. No adjustments were made to these saturations from the 1997 data. Occupancy sensors were estimated to have about a 5% overall saturation, concentrated primarily in offices and schools. Outdoor controls, primarily photocells and timers, were estimated to have about a saturation of about 80 percent. For small customers, saturations of occupancy sensors and photocells were estimated to be 2% and 75%, respectively.
Space Cooling
Saturation estimates of efficient DX and chiller equipment were set to zero because the CEC's emergency equipment efficiency standards significantly increased the efficiency of units required at burnout. Units with efficiencies that exceed these new standards have very low current saturation levels. The saturation of cooling system tune-up/diagnostic measures were set at 50 percent to reflect the fact that not all units are in a poorly commissioned state (no empirical estimates of saturation for these measures were available from sources with which we are familiar). Saturations of other cooling measures - window film (or similar window treatments), cool or light colored roofs, EMSs, and multi-speed/VSD chilled-water circulation pumps - were based on the PG&E CEUS and varied by business type and type of cooling system.
Ventilation
The saturation of variable-speed drive (VSD) controls for ventilation motors was based on data from the PG&E CEUS. Saturations of this measure increased with motor size. Average saturations for these measures were estimated to be 3% for motors in the 5 hp range, 9% for motors in the 15 hp range, and 39% for motors in the 40hp range. (Note that while VSD saturations are fairly low for the smaller motor ranges, the feasibility of VSD installations in these smaller ranges is also fairly low.) The saturation of premium-efficiency ventilation motors was set to zero as this measure was modeled as replace-on-burnout.
Refrigeration
Refrigeration measure saturations were developed primarily from the LBNL refrigeration study and supplemented, where necessary, using program filing documents and interviews with industry experts. We caution the reader in this area as the LBNL study is national in scope rather than reflecting the California market, and few other sources were checked for consistency across sources. Of those that were reviewed, there are substantial differences between the national market and the California market for certain measures. We recommend further work in this area. Refrigeration measures were applied only to the commercial grocery store segment.
Office Equipment
The saturation estimates of office equipment energy efficiency measures were developed from an analysis conducted at the national level by LBNL2 and summarized by Energy Solutions. Saturations are shown in Table A-10.
Table A-10
Saturations of Office Equipment Measures
Equipment |
Measure |
Saturation |
Notes |
PC |
Power Management Enabling |
0.35 |
|
PC Monitor |
LCD monitor |
0.29 |
|
|
Power Management Enabling |
0.60 |
|
|
Network Power Management Enabling |
0.00 |
Only applies to 40% of monitors that don't have individual power management enabled. |
|
External hardware control |
0.60 |
|
Copier |
Power Management Enabling |
0.67 |
This reflects units that are low-power enabled; about 1/3 of all units are also power-off enabled. |
Laser Printer |
External hardware control |
0.01 |
Only feasible for 70% of units that are not already manually shut down |
|
Nighttime shutdown |
0.30 |
|
A.2.4 Description of Measures Included in the Study
This subsection provides brief descriptions of the measures included in this study.
Lighting
T-8 Lamps with Electronic Ballast: T-8 lamps are a smaller diameter fluorescent lamp than T-12 lamps. When paired with specially designed electronic ballasts, T-8 lamps provide more lumens per watt resulting in energy savings. Electronic ballasts replace the standard core and coil technology in magnetic ballasts with solid-state components. This technology allows for more consistent control over ballast output and converts power to higher frequencies, causing the fluorescent lamps to operate more efficiently.
Reflectors: Optical reflectors are mirrored surfaces installed in fluorescent fixtures to direct light toward a specific area or work surface. By installing optical reflectors, four-lamp and three-lamp fluorescent fixtures can be reduced to two lamp fixtures and still meet the needed lighting levels.
Occupancy Sensors: Occupancy sensors (infrared or ultrasonic motion detection devices) turn lights on upon entry of a person into a room, and then turn the lights off from ½ minute to 20 minutes after they have left. Occupancy sensors require proper installation and calibration. Their savings depend on the mounting type.
Continuous Dimming: Dimming electronic ballasts can be incorporated into a daylighting strategy around the perimeter of office buildings or in areas under skylights. These systems use photocells to reduce power consumption and light output when daylight is available.
Compact Fluorescent Lighting (CFLs): Compact fluorescent lamps are designed to replace standard incandescent lamps. They are approximately four times more efficacious than incandescent light sources. Screw-in modular lamps have reusable ballasts that typically last for four lamp lives.
Halogen PAR Flood Lights: Halogen PAR (parabolic aluminized reflector) lamps use an enclosed tungsten filament within a halogen-filled glass tube. This design allows them to remain brighter for a longer time. A 90-watt halogen PAR lamp can replace a conventional 150-watt PAR lamp.
Metal Halide Lamps: Metal halide lamps are HID lamps, which are approximately four times more efficacious than incandescent lamps. Metal halide (MH) lamps are a form of high intensity discharge (HID) lighting with good lighting efficiency and excellent color rendition.
High Pressure Sodium Lamps: In many situations, 400 watt mercury vapor lamps can be replaced by 250 watt high pressure sodium (HPS) lamps. HPS lamps are HID lighting and emit a golden-white or yellow light. The color rendition for HPS lamps is worse than for MV lamps, but the number of lumens per watt, although dependent on the size of the lamps, is much improved over MV lamps.
Outdoor Lighting Controls (Photocells and Timeclocks): Photocells can be used to automatically control both outdoor lamps and indoor lamps adjacent to skylights and windows. When lights do not need to be on all night, a photocell in series with a time clock provides maximum savings and eliminates the need for manual operation and seasonal time clock adjustments. Time clocks enable users to turn on and off electrical equipment at specific times during the day or week.
Space Cooling
Chiller Efficiency Upgrade: Centrifugal chillers are used in building types which normally use water-based cooling systems and have cooling requirements greater than 200 tons. Centrifugal chillers reject heat through a water cooled condenser or cooling tower. In general, efficiency levels for centrifugal chillers start at 0.80 kW/ton (for older units) and may go as high as 0.4 kW/ton. This measure involves installation of a high-efficiency chiller (0.51 kW per ton) versus a standard unit (0.58 kW per ton).
Energy Management System: The term Energy Management System (EMS) refers to a complete building control system which usually can include controls for both lighting and HVAC systems. The HVAC control system may include on\off scheduling and warm-up routines. The complete lighting and HVAC control systems are generally integrated using a personal computer and control system software.
VSD - Cooling Circulation Pumps: Variable speed drives installed on chilled water pumps can reduce energy use by varying the pump speed according to the building's demand for cooling. There is also a reduction in piping losses associated with this measure, which can have a major impact on the heating loads and energy use for a building. Pump speeds, however, can generally only be reduced to a minimum specified rate, because chillers and the control valves may require a minimum flow rate to operate.
DX Packaged System Efficiency Upgrade: A single-package A/C unit consists of a single package (or cabinet housing) containing a condensing unit, a compressor, and an indoor fan/coil. An additional benefit of package units is that there is no need for field-installed refrigerant piping, thus minimizing labor costs and the possibility of contaminating the system with dirt, metal, oxides or non-condensing gases. This measure involves installation of a TIER 2 high-efficiency unit (EER=10.9) versus a standard unit (EER=10.3). The 10.3 EER unit recently became a requirement in California as part of the AB970 emergency Title 24 standards.
Evaporative Pre-cooler: Evaporative pre-cooler pre-cools outdoor air through an air-to-water heat exchanger so that the outdoor supply air is sensibly cooled and humidity is not raised. This process is designed to reduce the need for mechanical cooling by providing a cooler than ambient source of supply outdoor air. The effectiveness of this measure is highly dependent on the characteristics of the outdoor and the cooling requirements of the building.
Programmable Thermostat: Setback programmable thermostats are appropriate controls for HVAC equipment that serve spaces with regular occupied and unoccupied periods, resulting in long periods of time when heating and cooling setpoints can be adjusted.
Window Film: Reflective window film is an effective way to reduce solar energy gains, thus reducing mechanical cooling energy consumption. Windows affect building energy use through thermal heat transfer (U-value), solar heat gains (shading coefficient), daylighting (visible light transmittance), and air leakage.
Cool Roof: The color and material of a building structure surface will determine the amount of solar radiation absorbed by that surface. By using an appropriate reflective material to coat the roof, the roof will absorb less solar radiation and consequently reduce the cooling load.
Tune up/Advanced Diagnostics: The assumed tune-up includes cleaning the condenser and evaporator coils, establishing optimal refrigerant levels, and purging refrigerant loops of entrained air. The qualifying relative performance range for a tune-up is between 60 and 85 percent of the rated efficiency of the unit. Includes fresh air economizer controls providing demand control ventilation and consisting of a logic module, enthalpy sensor(s), and CO2 sensors in appropriate applications.
Ventilation
Motor Efficiency Upgrade: Premium-efficiency motors use additional copper to reduce electrical losses and better magnetic materials to reduce core losses, and are generally built to more precise tolerances. Consequently, such motors are more reliable, resulting in reduced downtime and replacement costs. Premium-efficiency motors may also carry longer manufacturer's warranties.
VSD on Motor Installation: Energy usage in HVAC systems can be reduced by installing electronic variable frequency drives (VFDs) on ventilation fans. VFDs are a far more efficient method of regulating speed or torque than throttling valves, inlet vanes and fan dampers. Energy required to operate a fan motor can be reduced as much as 85% during reduced load conditions by installing a VFD.
Refrigeration
Motor Efficiency Upgrade for Fans and Compressors: In addition to saving energy, premium-efficiency motors are more reliable, resulting in reduced downtime and replacement costs.
Evaporator Fan Controller for Medium Temperatur Walk-Ins: In response to the temperature setpoint being satisfied in a medium temperature walk-in cooler, evaporator fans are cycled to maintain minimum necessary air flow, which prevents ice build-up on the evaporator coils. In conventional systems, fans run constantly whether the temperature setpoint is satisfied or not.
Strip Curtains: Installing strip curtains on doorways to walk-in boxes and refrigerated warehouses can produce energy savings due to decreased infiltration of outside air into the refrigerated space. Although refrigerated spaces have doors, these doors are often left open, for example during product delivery and store stocking activities.
Night Covers: Installing film or blanket type night covers on display cases can significantly reduce the infiltration of warm ambient air into the refrigerated space. This reduction in display case loads in turn reduces the electric use of the central plant, including compressors and condensers, thus saving energy. The target market for this measure is small, independently owned grocery stores and other stores that are typically closed at night and restock their shelves during the day. The target cases are vertical displays, with a single- or double-air curtain, and tub (coffin) type cases.
Humidistat Controls: A humidistat control is a control device to turn refrigeration display case anti-sweat heaters off when ambient relative humidity is low enough that sweating will not occur. Anti-sweat heaters evaporate moisture by heating the door rails, case frame and glass of display cases. Savings result from reducing the operating hours of the anti-sweat heaters, which without a humidistat control generally run continuously. There are various types of control strategies including cycling on a fixed schedule.
Demand Defrost Controls: Defrost of evaporator coils in freezer displays is normally completed on a timed basis, but this is wasteful, as the time interval is designed to remove ice around the coil under worst case humidity levels. Demand defrost sensor and control systems are designed to optimize coil defrost. Demand defrost controls can work in conjunction with both electric heat defrost and hot gas defrost systems. Unfortunately, at the time, industry experts suggest that this technology is still in an early stage of design and not yet ready for the market. However, in the near future this technology should be viewed as a substantial opportunity for energy savings.
Floating Head Pressure Controls: Floating head pressure controls allow a refrigeration system to operate under lower condensing temperature and pressure settings, where compressor operation is most efficient, working against a relatively low head pressure. The condensing temperature is allowed to float below the design setpoint of, say, 95 deg. F under lower outdoor temperatures, which in-turn lowers the condensate pressure. In a conventional system a higher fixed condensing temperature setpoint is used which results in a lowered capacity for the system, requires extra power, and may overload the compressor motor. Energy savings can be realized if the refrigeration system head pressure is allowed to float during periods of low ambient temperature, when the condensing temperature can be dramatically reduced.
Variable Speed Compressor Retrofit: A variable speed compressor is a screw or reciprocating compressor whose current is modulated by a frequency inverter. A controller senses the compressor suction pressure and modulates the current and therefore the motor speed in response to changes in this pressure. When low load conditions exist, the current to the compressor motor is decreased, decreasing the compressor work done on the refrigerant.
Retrofit Glass Door on Medium Temperature Displays: Like the freezer case doors that are now common practice in grocery stores, there are opportunities to install doors on existing medium temperature displays, resulting in display load reductions and thus energy savings.
Office Equipment
Power Management Enabling: This measure can be applied to PCs, PC monitors, and copiers. For PCs and copiers, manual enabling of the power management features is the only viable solution. For monitors, manual enabling and group enabling via network software are options.
LCD Monitors: LCDs are becoming more attractive options in terms of quality. However, because they cost five times more than a comparable CRT, until prices drop, using them purely as an energy saving measure will not be an option for most desktop users.
External Hardware Controls: Occupancy sensors have been used for years to conserve energy in office lighting applications. The application has expanded to include other office equipment as "plug-load sensors" incorporate an occupancy sensor with a relay that is able to turn equipment that is plugged into it on or off. The plug-load sensors range from devices that control a single electrical outlet or piece of equipment, to devices that control multiple outlets and can work together with other sensors.
Printer Nighttime Shutdown: The simplest action to save printer energy is to shut the machine off at night. While this recommendation is particularly important for conventional printers without power management, it is important to turn off ENERGY STAR printers as well, as they can draw up to 30-45 watts when in low power mode.
1 The age and lack of consistency in available measure saturation data represent an important limitation to this study. We believe we have made the best possible estimates based on the available information. Fortunately, a new commercial end use study is now underway that will provide updated and consistent measure saturation data across the major investor-owned utility service territories in California. 2 Wawamoto, Kaoru, J. Koomey, B. Nordman, R. Brown, M.A. Piette, M. Ting, A. Meier, Electricity Used by Office Equipment and Network Equipment in the U.S., LBNL, February 2001.