THE STATUS OF TELECOMMUNICATIONS
COMPETITION IN CALIFORNIA
Second Report
For the Year 2002
Chapter 1. Executive Summary
The Second Report on the Status of Telecommunications Competition in California focuses on the California marketplace with some comparisons to national trends. Staff from the California Public Utilities Commission's (CPUC or Commission) Telecommunications Division prepared this report in response to Section 316.5 of the California Public Utilities Code. Section 316.5 requires that the CPUC report on the status of competition in the telecommunications marketplace, significant changes that have occurred in the previous year, and statutes that should be amended, repealed, or enacted to promote competition.
Chapter 2 provides a contextual overview, including the mandate, for the report. Key findings from wireline, wireless, and broadband market analyses are summarized below and discussed in detail in Chapter 3. Significant regulatory issues impacting telecommunications in California were evaluated and are addressed in Chapter 4.
1.1 Key Findings in Wireline Voice Markets
Wireline voice markets consists of local, local toll, and long-distance telecommunications services delivered by incumbents (ILECs), competitors (CLECs), and inter-exchange/long distance carriers (IECs) These markets were evaluated in terms of relative market share and growth trends. The analysis emphasizes the level of activity experienced by incumbent versus competitor carriers as well as residential versus business market segments. In addition to revenues, wireline market share was determined on the basis of carrier-reported access lines, which are owned or leased in order to provide telecommunications service to customers within California.1
Within each sector, market share was evaluated in terms of carrier access lines as of June 2002 and carrier revenues for the period January 2001 through June 2002. The analysis is based on data responses of 162 (22 ILECs and 140 CLEC/IECs) of 275 wireline carriers registered to do business in California. Staff found that, as of mid-2002, ILECs continue to control the local wireline market in California, although CLECs are gaining ground in the local toll market. SBC, formerly SBC Pacific Bell2, continues to lead the local and local toll marketplaces, earning more than all CLECs combined. Key findings follow. Unless otherwise stated, the time period reviewed covered the eighteen months between January 2001 and June 2002.
Local Market
_ ILECs control a 95% market share of the statewide local residential market as measured by June 2002 access line data, as compared to CLECs' 5% market share.
_ For California's local business markets, ILECs hold 83% of the market, as compared to over 16% for CLECs.
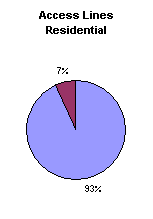
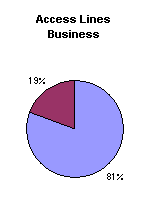
_ Within its franchise area, SBC controls 93% of the residential market and 80% of the business market as measured by access lines, compared to CLECs' 7% and 20% respectively.
_ As measured by access lines, the top two companies in California's local residential and business markets are SBC and Verizon, both ILECs.
_ In order from largest to smallest, the top three competitors in California's local residential market based on access lines are: Cox Communications, AT&T, and WorldCom.
_ The top three California local business market competitors based on access lines are: AT&T, PacWest, and Allegiance (in order from largest to smallest).
_ ILECs still dominate local residential and business markets, with 96% of total revenues in California (98% of residential revenues and 93% of business revenues).
Local Toll Market
_ An estimated $2.1 billion in revenues was earned from local toll service in California between January 2001 and June 2002.
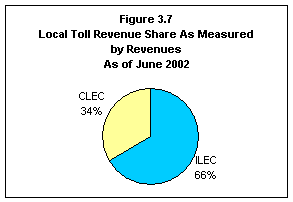
_ During this eighteen-month period, ILECs earned 66% of these revenues, down from 76% market share reported in 2000.
_ CLECs'/IECs' share of local toll revenues was 34%.
_ CLECs/IECs earned 43% of the business local toll revenues and approximately 25% of the residential local toll revenues.
_ Four companies collectively earned 88% of residential local toll revenues in California: SBC, Verizon, WorldCom, and AT&T (in order from largest to smallest).
_ SBC earned 70% of residential local toll revenues.
_ Four companies collectively earned 85% of business local toll revenues in California: SBC, WorldCom, AT&T, and Sprint (in order from largest to smallest).
_ SBC alone earned nearly half of business local toll revenues.
Long Distance Market
_ An estimated $1.55 billion in revenues was earned in California's long distance market.
_ Residential long distance services generated just over half of these revenues.
_ Market share in California's long distance market is concentrated among a few carriers.
_ The top 3 residential market long distance providers in California, earning 68% of revenues, are: AT&T, WorldCom, and Verizon Long-Distance (in order from largest to smallest).
_ The top 3 business market long distance providers in California, earning 75% of revenues, are: AT&T, WorldCom, and Sprint (in order from largest to smallest).
1.2 Key Findings in Wireless Voice Market
The CPUC's analysis of California's wireless industry indicates continued growth based on revenues. There appears to be competition among five core wireless companies. In addition, the wireless sector's share of billable revenues (those revenues from which surcharges are provided to the CPUC for subsidizing public programs) is increasing while the ILECs' share is declining.The wireless analysis is based on data request responses from 10 of 197 wireless companies registered in California, consisting of the five leading companies and five of the smaller companies, supplemented by secondary national data. Key wireless market findings are summarized below. Unless otherwise indicated, the time period reviewed was from January 2000 through June 2002.
_ There was an estimated 22 % increase in the number of California wireless customers to approximately 15 million in 2002.
_ The California wireless market remains concentrated among five large companies, listed in alphabetical order: AT&T Wireless, Cingular, Nextel, Sprint PCS, and Verizon Wireless.
_ In terms of customers and revenues, the specific ranking of the "big five" wireless carriers remained fairly stable in 2000, 2001, and the first half of 2002.
_ Wireless revenues earned by the top five companies have been increasing annually with revenues being substantially higher in 2001 ($9.7 billion) than in 2000 ($6.6 billion).
_ California comprises 12% of the US wireless market based on customers.3
_ The market share for the top five wireless companies is growing, as together they gained an additional 6% of the market, going from 90% in 2001 to 96% in 2002.4
_ While wireline assigned numbers have been stable in California, wireless carriers have increased their assigned numbers by 39% over a two-year period.
1.3 Key Findings in Broadband Markets
Fourteen of 22 registered DSL providers in California responded with data indicating that they are still active in the market serving customers directly or through an affiliate. In the cable modem market, only nine of 276 cable companies registered in California provided data. Because of the low response rate, FCC data was selected to provide a picture of the cable modem industry in California as compared to the nation. Key findings, including a discussion of the relative market position of DSL and cable modem in the state, are summarized below. Chapter 3 also contains maps of the relative availability of DSL and cable modem access throughout California.
DSL MARKET
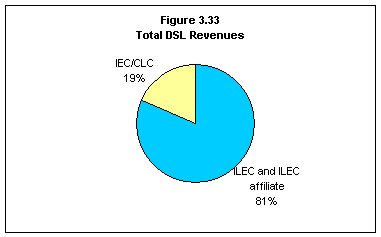
_ The two largest ILECs, SBC and Verizon, and their affiliated DSL companies (ASI and VADI, respectively) account for 81% of California's DSL market.
_ CLECs unaffiliated with ILECs hold 18% of the DSL lines in California.
_ Small ILECs operating in lower population franchise areas provide only 1% of the DSL lines in California.
_ DSL has reached an estimated 10% of its market potential in California.5
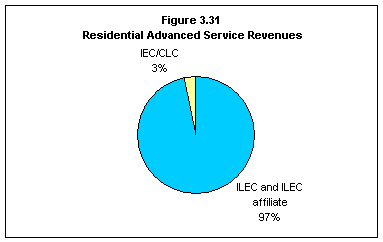
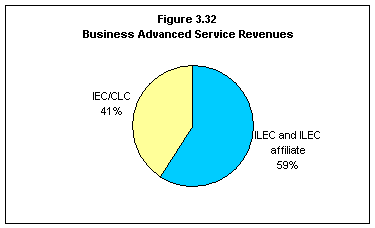
_ ILECs and ILEC affiliates hold a greater share of the residential DSL market (97%) than their share of the business DSL market (59%).
CABLE MODEM MARKET
_ Cable modem customers increased by more than 20% every six months between June 2000 and December 2001.
_ The number of cable modem carriers has remained fairly constant in California over the 18-month period through December 2001, although nationally, the number has increased by 64%. Cable modem's share of the overall broadband market appears to be increasing in California, from 33% in June 2000 to 39% in December 2001. The same trend holds nationally, where cable modem's share of the market grew from 52% to 55%.
Comparison of DSL and Cable Modem Broadband Markets
_ Between June 2000 and December 2001, cable modem lines in California increased 165%, while DSL lines grew 143%.6
_ DSL (with a 45% market share of the California broadband market) is outpacing cable modem (with a 39% market share) in California's broadband market.
_ In contrast, nationally, cable modem is the preferred broadband access for 55% of all high-speed Internet subscribers and DSL accounts for 31% of subscribers nationwide.
_ One quarter of California cities have a choice between DSL or cable modem high-speed access to the Internet.
1.4 Key Regulatory Issues Impacting Telecommunications
Chapter 4 of the report discusses key regulatory issues impacting the competitive telecommunications landscape in California. The issues covered, summarized below, include economic concerns such as long distance market entry as well as consumer issues related to information, service quality, and choice.
Issues Discussed in the Second Report
_ The Commission recommended FCC approval of SBC's entry into the California long distance market: In a September 2002 decision, the Commission found that SBC had met 12 of the 14 criteria set fourth in the federal Telecommunications Act of 1996 (TA '96) for entry into the long distance market. In December 2002, the Commission found, in accordance with California Public Utilities Code 709.2, sufficient safeguards were in place to ensure that SBC's long distance market entry will support the public interest.
_ SBC's Performance Incentive Plan assures CLECs receive the same service as other SBC customers. The Commission established a plan to discourage SBC from providing inadequate service to CLECs when they need access to the SBC network. The plan requires SBC to make payments if performance deteriorates below established standards.
_ SBC and Verizon UNE Proceedings. The Commission is revising the prices CLECs pay to lease unbundled network elements (UNEs) from ILECs
_ FCC Triennial Review. The Telecommunications Act of 1996 (TA '96) (FCC 96-325) requires the Bell ILECS to provide access to Unbundled Network Element Platform UNE-P7 as a means for CLECs to provide local service. It is a highly contentious issue under current review by the FCC.
_ Local number portability is of growing importance to CLECs' market share and its absence presents a barrier to competition. Consumers may be deterred from switching to new service providers if switching requires them to assume new phone numbers. Congress, the FCC, and the CPUC addressed this problem by requiring most wireline phone companies to allow customers to switch between phone service providers while retaining their original telephone number, known as number porting.8 Number porting activity has dropped from last year. Compliance with number porting requirements in the wireless market has been delayed by the FCC, presenting a barrier to consumer choice.
_ California Telecommunications Consumer Bill of Rights is being implemented to protect consumers and open communication between carriers. A report by the CPUC Telecommunications Division found that consumers and ultimately the competitive market would benefit from clearer rules for wireless and wireline carriers, a review of tariffs and consumer protection policies, and a review of carriers' limited liability language. In 2000, the Commission held 20 public participation hearing sessions and garnered substantial input from consumers. The general public sentiment was overwhelmingly in favor of the Commission taking on a much stronger consumer protection role.
_ Quality of service control measures being considered in response to increasing consumer complaints.
In early December 2002, the Commission opened a proceeding to revise the ten-year-old standards it has been using to judge telecommunications service quality. The action was necessitated because of the evolution of telecommunications technology and changed business conditions. This proceeding will establish rules for all carriers providing retail telecommunications products or services to end users in California, including DSL and wireless providers.
_ Federal and State regulators are focusing on broadband. . Proceedings are underway that seek to clarify the appropriate legal and regulatory frameworks applicable to broadband services and which will have significant impact on the maturation of the broadband marketplace. These services include digital subscriber line (DSL), cable modem, and wireless broadband.
Chapter 2. Introduction and Background
This chapter describes the framework for this Second Report on the Status of Telecommunications Competition in California. An overview of the report methodology and telecommunications industry contextual information follows, including the mandate for this report, the markets studied, the types of telecommunications competitors, the market structure that has arisen from state and federal regulatory actions, and the customer segments that were studied.
2.1 Purpose of Report
Section 316.5 of the California Public Utilities Code mandates that the California Public Utilities Commission (CPUC or Commission) annually submit a report on the status of competition and deregulation in the telecommunications industry to the State Legislature. The reporting requirement is effective until January 1, 2004. Staff of the CPUC's Telecommunications Division prepared the report on behalf of the Commission.
Section 316.5 requires that the CPUC's report on telecommunications competition review the following:
a) The status of competition in the telecommunications marketplace;
b) Significant changes that have occurred in the telecommunications marketplace in the previous year;
c) Any statutes that might impede or discourage competition in, or deregulation of, the telecommunications marketplace; and
d) Recommendations to the Legislature on statutes that should be amended, repealed, or enacted to enhance and reflect the competitive telecommunications environment, and/or promote the orderly deregulation of the telecommunications industry.
2.2 Markets Studied
To assess the status of telecommunications competition in the State of California, CPUC staff surveyed companies that are registered in California to provide one or more of the following services:
· Wireline Voice Communications (local, local toll, and long distance)
· Wireless Voice Communications
· DSL Broadband Communications
· Cable Modem Broadband Communications
CPUC data requests were sent to: 275 wireline Carriers (60% response rate); 197 wireless Carriers (5% response rate); 22 DSL providers (100% response rate); 276 cable companies (3.6% response rate). Companies were asked questions about revenues, customers, access lines (network infrastructure), geographic service areas, target markets, prices, and future plans. Where carrier responses did not generate the amount of detailed information requested, staff relied upon supplemental national data to develop estimates of incumbent and competitor market shares.
2.3 Telecommunications Competitors
Companies may provide service over copper wire, coaxial cable, fiber optic cable, or wireless infrastructure. Wireline voice markets consist of local, local toll and long distance services provided over wireline infrastructure by ILECs, CLECs and IECs to residential and business consumers in California. Wireless voice markets are served by wireless companies. Broadband markets are served by broadband data service providers which may be wireline providers (DLECs), wireless providers, or cable providers. Each of these competitor types and the markets they serve are discussed below.
Wireline Telecommunications Competitors
ILECs (Incumbent Local Exchange Carriers) - ILECs are the traditional wireline telecommunications carriers operating in defined geographic areas. Prior to 1996, for local service (and prior to 1995 for local toll service), ILECs operated as monopolies having the exclusive right and responsibility for providing local and local toll telephone service in defined geographic areas.9 Currently, two large ILECs (SBC and Verizon,) two mid-sized ILECs (Citizens and Roseville,) and eighteen small ILECs10 operate in California. Also, some ILECs have affiliates that offer long distance, wireless and/or broadband services.
CLECs (Competitive Local Exchange Carriers) - CLECs are wireline carriers authorized under state and federal regulations to compete with ILECs to provide local telephone service. They often package their local service offerings with local toll, long distance, international, Internet access, cable and/or video services. Under policies adopted by the CPUC, the Federal Communications Commission (FCC) and the Telecommunications Act of 1996 (TA '96), CLECs can choose which types of customers to serve (business, residential or both) and what services to offer. CLECs provide telephone services in one of three ways or a combination thereof:
a) by building or rebuilding telecommunications facilities11;
b) through the purchase of telecommunications services from another carrier (typically an ILEC) at wholesale rates and, then, reselling those services to their own customers at retail rates12; and
c) by leasing parts of the ILEC network referred to as "unbundled network elements" (UNEs).
Some larger CLECs operating in California are AT&T, Pac-West Telecommunications Inc., and Cox California Telecom, LLC. Some ILECs have also been given authority to become CLECs outside their original service territories. In California, SBC and Verizon each have authority to operate as CLECs in each other's service areas.13
IECs (Inter-Exchange Carriers) - IECs are typically defined as wireline "long distance" carriers. IECs may provide long distance services to customers using their own facilities or by reselling long distance services they have purchased from another carrier to their customers. Some IECs also offer local and local toll telecommunications services in addition to international, Internet access, cable and/or video services. Other IECs are affiliates of ILECs. Some IECs operating in California are AT&T, Sprint Communications LLP (Sprint), WorldCom, Verizon Long Distance, Roseville Long Distance, Sierra Telephone Long Distance, and Working Assets. IECs are often registered as CLECs.
Wireless and Broadband Communications Competitors:
DLECs (Data Local Exchange Carriers) - The TA '96 encourages the deployment of advanced telecommunications capability. DLECs are those carriers that deliver high-speed data transmission service (broadband) but not voice service. Typically, DLECs deliver services such as high-speed access to the Internet. ILECs and CLECs may have DLEC functions or subsidiaries. DLECs operational in California include Covad Communications Company and SBC's data affiliate Advanced Solutions Inc. (ASI).
Cable Companies - Cable providers offer a variety of voice and data services to customers over a network that uses coaxial cable instead of copper wires. Despite the technical differences, cable providers with suitably upgraded networks can directly compete with ILECs in the provision of voice and data services. Residential customers are a particular market segment targeted by cable providers because cable video services already go to many homes across the nation. Cable providers such as AT&T, Cox Communications, Comcast, and Cablevision offer residential telephone and data services in a number of U.S. markets.
Wireless Companies - Wireless companies may provide voice and/or broadband services. Wireless broadband services are delivered using fixed wireless or satellite technology. It is estimated that both have limited deployment levels to date in California. Fixed wireless technology, which relies on antenna towers to send and receive data, can offer services to large geographic areas with a modest investment. Since only limited new infrastructure is required, fixed wireless is particularly attractive in rural areas, smaller towns, and suburbs. Sprint Broadband Direct is an example of a fixed wireless provider serving a limited number of customers in certain select areas in California. Satellite technology is another option for rural areas but the costs are substantial. There is also a growing movement of wireless Internet use from remote locations such as cafes and community hubs through the use of Wireless Fidelity (or WiFi), which requires a PC card that works with a wireless hub connected to users through the unlicensed wireless spectrum to deliver high speed Internet access to users. End-users subscribe with wireless Internet service providers such as Surf-n-Sip and T-Mobile Hotspot to access these wireless hubs.
2.4 Telecommunications Market Overview
There are three broad categories of wireline services that may be offered by ILECs, CLECs, and IECs: (1) local service, (2) local toll service, and (3) long distance service. Local service typically includes a guaranteed set of functions quaintly termed "plain old telephone service" (POTS).
These functions are usually provided for a standard monthly charge which covers the provision of dial tone on the customer telephone line, the ability to place and receive voice and data calls over basic telephone lines, and the cost of local calls within a limited, geographic area. For some carriers, local service may also include such features as directory assistance, operator services, access to 911, and discretionary services such as call waiting, caller ID, call forwarding and dial-up Internet access. For the purposes of this report, local service includes both POTS and the additional features described above.
The current regulatory framework governing local, local toll, and long distance services is the result of the divestiture of AT&T in 1984, prompted by a settlement between the United States Department of Justice and AT&T over antitrust allegations. Geographical areas called LATAs (Local Access and Transport Areas) were created throughout the United States as a result of the approved AT&T settlement. Initially, only ILECs were allowed to provide telecommunications services within the LATA. Thus, ILECs provided both local service as well as local toll service, i.e. calls made to destinations within the LATA but outside of the "free" local calling area.
As a result of the AT&T divestiture, IECs were allowed to provide telecommunications services between LATAs, i.e. long distance service. Competitors such as WorldCom and Sprint began to offer long distance service in competition with AT&T in the 1970's and now more than 700 companies offer long distance service nationwide.14 Regional Bell Operating Company (RBOC) affiliated ILECs were initially prohibited from providing long distance services.15
The telecommunications marketplace has evolved since divestiture. In 1994, the CPUC authorized competition for local toll services in California with the issuance of D.94-09-065 allowing other carriers to enter that market along with the ILECs. In 1996, the Congress enacted the Telecommunications Act of 1996 (TA '96) which makes provision for these RBOC affiliated ILECs, including SBC, to enter the long distance market with regulatory approval.
As the telecommunications marketplace evolves, delineation between local, local toll, and long distance services are less and less distinct. For example, some carriers have packaged local toll and long distance services together. Some carrier calling plans offer a flat per-minute-of-use charge for both local toll and long distance calls.16 Other plans offer a flat monthly rate for local toll and long distance service that covers a maximum number of minutes of use.17 In some cases, therefore, the focus is switching away from the geographic delineations of LATAs and switching toward a minutes of use pricing basis.
2.5 Customer Segments
Residential and business services are regulated and marketed differently. In California, residential and business customers pay different rates for local service. There are also distinct policies and residential consumer protections in place that do not apply to business customers. For instance, subsidy programs such as Universal Lifeline Telephone Service assure residential customers access to basic telecommunications service, but the program is not available to business customers. As the telecommunications marketplace opened to competition, new competitors focused on specific customer classes and service types. Many competitors do not provide the same range of services as ILECs. Where possible, the Second Report on Telecommunications Competition in California looks at market share in terms of residential versus business customers within the wireline and wireless market sectors.
Chapter 3. Telecommunications Competition
Chapter 3 evaluates competition levels in California's voice and broadband communications markets. Voice markets encompass: (1) wireline services within local, local toll, and long-distance market segments, and (2) wireless services. Broadband markets encompass: (1) Digital Subscriber Line service, and (2) Cable Modem service.
Services and technologies that are still in a developmental or early deployment stage are also discussed, namely wireless Internet access/networking and Internet Protocol technologies (which enable voice streaming over the Internet) which are apt to grow, but not yet used by a significant portion of the population.
Within the core voice and broadband communications market sectors, market share is evaluated in terms of residential and business activity, and further in terms of customers or access lines and revenues earned. Where possible based on data availability, historical trends are presented. There is substantial emphasis on the comparison between competitor and incumbent market activity.18
3.1 Voice Communications - Wireline Services
The wireline market consists of local, local toll, and long-distance telecommunications services delivered by incumbents (ILECs), competitors (CLECs), and inter-exchange/long distance carriers (IECs).19 Within these sectors, market share was evaluated in terms of carrier access lines20 as of June 2002 and carrier revenues for the period January 2001 through June 2002.
Data was derived from 162 of 275 carriers that responded to a request for data conducted for the purposes of this wireline analysis (22 ILECs, 140 CLEC/IECs).21 A list of the carriers that responded can be found in Appendix B.
3.1.1 Local Competition: ILECs Continue to Control California's Wireline Market
ILECs have a 95% share of the local residential market statewide, as measured by June 2002 access line data, compared to the CLECs' 5% market share. (See Figure 3.1.) California's local business market has been somewhat more competitive with CLECs attaining a market share in excess of 16%, compared to the ILECs almost 84% market share. (See Figure 3.2)
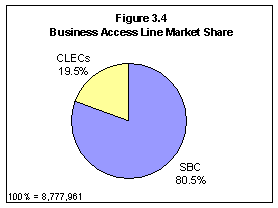
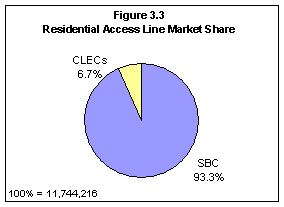
SBC serves at least 93% of the residential market and 81% of the business market within its California territory, as defined by June 2002 access line data. (See Figures 3.3 and 3.4.) These estimates are likely understated as they conservatively assume that all CLEC access lines are in SBC's territory, when, in fact, some portion of the access lines would be in other ILEC territories.22 Even so, SBC dominates California's residential and business telecommunications markets.
 Source: Responses to CPUC Wireline Data Request, sent to carriers in July 2002.
3.1.2 Local Competition: Majority of ILEC Customers are Residential While CLECs
Serve More Business Customers
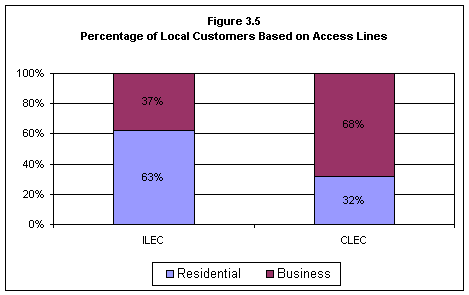
ILECs serve relatively more residential than business customers whereas CLECs serve relatively more business customers. As measured by access lines, ILECs' local customer base consists of 63% residential and 37% business customers. In contrast the local customer composition of CLEC is 32% residential and 68% businesses. (See Figure 3.5)
Source: CPUC Wireline Data Request, sent to carriers in July 2002.
As of June 2002, the top two companies in California's local residential and business markets are SBC and Verizon, both ILECs. The top local competitors to California ILECs in the local market were Cox Communications (Cox), AT&T, WorldCom, Pac-West, and Allegiance. AT&T is the only competitor that ranks with the top three in both the local residential and business markets, even though AT&T only recently returned to the California local residential market, and has historically focused only on business customers. Cox, another new entrant to the California local market, provides local telephone service via its own cable plant. The top three competitors in California's local markets, based on total access lines, are shown in Figure 3.6.
FIGURE 3.6TOP 3 ILECS COMPETITORS(BASED ON 2002 ACCESS LINE DATA) | ||
CLEC RANKINGS |
LOCAL RESIDENTIAL MARKET |
LOCAL BUSINESS MARKET |
1st |
COX |
AT&T |
2nd |
AT&T |
PAC WEST |
3rd |
WORLD COM |
ALLEGIANCE |
SOURCE: CPUC WIRELINE DATA REQUEST, SENT TO CARRIERS IN JULY 2002.
3.1.3 Local Wireline Market: ILECs Continue to Earn Vast Majority of Revenues
Revenues earned is another measure of market share. Consequently, carriers were asked to provide total operating revenues: i.e. local residential and business revenues, local toll (intraLATA) residential and business, long distance (interLATA) residential and business, access revenues, unbundled network element (UNE) revenues, and "other" revenues.
The data indicated that, for the period January 2001 through June 2002, ILECs earned nearly all of the local market revenues in California for the eighteen-month period ending June 2002, with 98% ($4.9 billion) of local residential revenues and 93% ($3.6 billion) of local business revenues. ILECs earned 96% and CLECs earned 4% of the combined residential and business local revenues. Comparing local revenue-based market share to access line-based market share (in which ILECs controlled 95% of the local residential market and 84% of the local business market), ILECs control more revenues than access lines, particularly in the local business market.
3.1.4 Local Toll Market: CLECs Increase Market Share, Yet ILECs Still Hold Dominant Share
During the period from January 2001 through June 2002, ILECs statewide earned approximately 66% of California's local toll revenues of approximately $2.1 billion. In contrast to the year 2000, when ILECs were measured to have had 76% market share, CLECs look to be gaining market share.23 (See Figure 3.7)
SOURCE: CPUC WIRELINE DATA REQUEST, SENT TO CARRIERS IN JULY 2002.
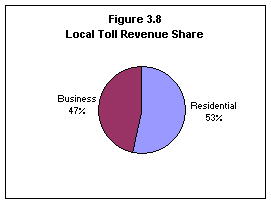
Local toll revenues are almost evenly divided between business and residential revenues. Within the local toll market, 53% of revenues earned by all carriers combined are from residential services while 47% come from business services. CLEC/IXCs are making headway into the business local toll market, with 43% ($434.2 million) of the revenues, although they are still surpassed by the ILECs' 57% ($571.1 million). In the residential local toll market, CLEC/IXC revenues are approximately one-quarter ($299 million) of ILEC revenues.
During the period January 2001 through June 2002, four carriers collectively earned 88% of the California residential local toll revenues: SBC, Verizon, WorldCom, and AT&T, in rank order. SBC alone controlled about 70% of the residential local toll market in its franchise area. In the business local toll market during the same period, the top four carriers were SBC, WorldCom, AT&T, and Sprint. Together, these companies collectively earned 85% of the total local business market, with SBC holding almost half.
FIGURE 3.9TOP 4 LOCAL TOLL COMPANIES(Based on 2002 Local Toll Revenue) | ||
RANKING |
RESIDENTIAL MARKET |
BUSINESS MARKET |
1ST |
SBC |
SBC |
2ND |
VERIZON |
WORLDCOM |
3RD |
AT&T |
AT&T |
4TH |
WORLDCOM |
SPRINT |
SOURCE: CPUC WIRELINE DATA REQUEST, SENT TO CARRIERS IN JULY 2002.
3.1.5 Long Distance Market: Market Share Concentrated Among a Few Carriers
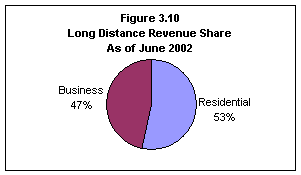
California's long distance industry earned $1.55 billion between January 2001 and June 2002, with 53% of revenues earned from residential customers and 47% from the business sector.
SOURCE: CPUC WIRELINE DATA REQUEST, SENT TO CARRIERS IN JULY 2002.
In terms of revenues between January 2001 and June 2002, AT&T, WorldCom, and Verizon Long Distance held an estimated 68% of the residential long distance market. An estimated 75% of the business market was handled by AT&T, WorldCom, and Sprint. AT&T and WorldCom were number one and two in both the business and residential long distance markets. This data indicates that California's long distance market share is concentrated among a few carriers.
FIGURE 3.11TOP 3 LONG DISTANCE COMPANIES(BASED ON 2002 LONG DISTANCE REVENUES) | ||
RANKING |
RESIDENTIAL MARKET |
BUSINESS MARKET |
1ST |
AT&T |
AT&T |
2ND |
WORLDCOM |
WORLDCOM |
3RD |
VERIZON LONG DISTANCE |
SPRINT |
SOURCE: CPUC WIRELINE DATA REQUEST, SENT TO CARRIERS IN JULY 2002.
3.1.6 Wireline Markets Compared: ILECs Continue to Earn Vast Majority of Local
Revenues, While CLEC/IECs Gain Ground in Local Toll Market
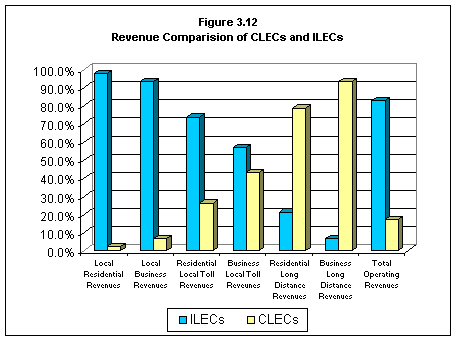
The figure below illustrates that ILECs dominate revenues earned for local, local toll services and total operating revenues. ILECs have 97.8% of the local residential revenue and 93.1% of the local business revenues; whereas CLECs have 2.2% of the local residential and 6.9% of the local business markets, respectively.24
The intraLATA toll market exhibits more competition with CLECs having 26.3% of the residential intraLATA toll revenue and 43.2% of the business intraLATA toll revenue. ILECs still dominate, however, with 73.7% of the residential intraLATA toll revenue and 56.8% of the business intraLATA toll revenue.
CLEC/IXCs have a greater share of long distance revenues-with the larger portion of the business long distance market, compared to the residential long distance market. By including the ILEC affiliates, ILECS have 21.3% of the residential long distance market share and 6.7% of the business long distance market. This analysis shows that, in advance of SBC's newly authorized entry into this market; ILECs (primarily Verizon's long distance affiliate) already have presence in the California Long Distance market.
Source: CPUC Wireline Data Request.
Revenue data is for the period from January 2001 through June 2002.
3.1.7 Wireline Markets Compared: SBC Versus CLECs Shows SBC Exceeding
CLECs In Market Share
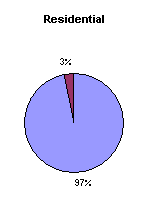
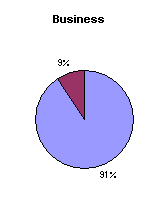
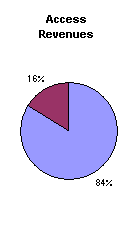
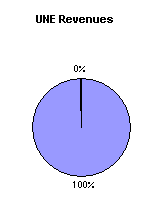
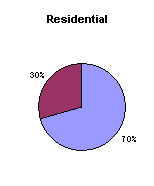
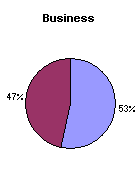
The pie charts on the next page (see Figure 3.13) compare access lines and revenues earned by SBC to the combined data of CLECs/IECs operating in California (even those operating outside of SBC's territory) for the period January 2001 through June 2002. This comparison overstates the competitors' market share, since a portion of CLECs/IECs access lines and revenues are outside of SBC's territory. Nonetheless, the data shows SBC market share exceeding competitors' in all but the interLATA toll (in-state long distance) category. .
Figure 3.13
California Communications Market Share Analysis
SBC-Pacific Bell Competitive Local Exchange Carriers (CLECs/IECs)
 Access Lines Local Revenues
IntraLATA Toll Revenues InterLATA Toll Revenues Total Operating Revenues
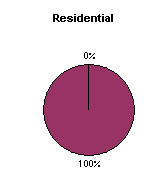
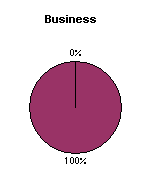
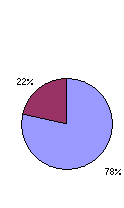
|
Residential Access Lines |
Business Access Line s |
Local Residential Revenues |
Local Business Revenues |
Residential IntraLATA Toll Revenues |
Business IntraLATA Toll Revenues |
Residential InterLATA Toll Revenues |
Business InterLATA Toll Revenues |
Access Revenues |
UNE Revenues |
Total Operating Revenues |
Pacific Bell |
93.3% |
80.5% |
96.9% |
90.7% |
69.9% |
53.4% |
0.0% |
0.0% |
84.0% |
99.8% |
78.4% |
CLECs |
6.7% |
19.5% |
3.1% |
9.3% |
30.1% |
46.6% |
100.0% |
100.0% |
16.0% |
0.2% |
21.6% |
3.2 Voice Communications - Wireless Services
The wireless data request was sent to 197 wireless firms registered to do business in California. Staff requested market information on trends in overall subscribership (customers), revenues, split between residential and business market activity, geographic service areas, fees charged to end-users, and future business plans. Data was received from the five dominant wireless players in California plus five smaller competing firms.25 In addition to the data request, staff consulted reports published by the FCC and by the North American Numbering Plan Administrator (NANPA) to evaluate the wireless market based on telephone numbers assigned to customers and California's proportion of the U.S. wireless market.
3.2.1 Wireless Industry: Top 5 Wireless Carriers Continue to Lead in California
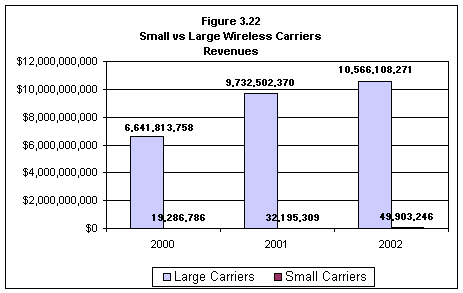
CPUC staff analysis of customers and revenues indicates that the wireless industry in California remains competitively concentrated among the same top five carriers as were identified in the CPUC's First Competition Report issued in June 2002. The top five companies, listed in alphabetical order are: AT&T Wireless, Cingular Wireless (a merger between SBC and BellSouth), Nextel, Sprint PCS, and Verizon Wireless. As of June 2002, these five companies combined served approximately 15 million customers growing by almost 22 percent from December 2000. Half-year data for the period ending June 2002 shows leveling customer growth in 2002. Revenues for these companies grew from $6.6 billion in 2000 to $9.7 billion in 2001 and (based on annualized first six months of revenue data) are on pace to reach $10.6 billion in 2002.
Figure 3.14: Trends in Wireless Customers and Revenues Top 5 Companies in California | |||
Jan-Dec 2000 |
Jan-Dec 2001 |
Jan-June 2002 | |
Customers |
12,328,513 |
15,096,268 |
15,009,783 |
Revenues |
$6,641,813,758 |
$9,732,502,370 |
$5,283,054,175 |
Source: CPUC Wireless Data Request, sent to carriers in August 2002.
3.2.2 Wireless Industry: Top 5 Gain Another 6 Percent of Market
Changes in assigned wireless telephone numbers, those numbers in use by customers, are another measure of customer growth. This analysis, based on data from the NANPA, validated CPUC staff's prior findings that the same five companies continue to dominate California's wireless market.26 Additionally based on assigned telephone numbers, the top five picked up 6 percent more customers from the smaller wireless companies in 2002 from 90 percent to 96 percent combined market share.27
Source: Numbering Resource Utilization and Forecast (NRUF) report produced by the
North American Numbering Plan Administrator (NANPA) 9/02.
3.2.3 Wireless Industry: Top 5 Market Share Similarly Distributed Across Years
Responses to the CPUC wireless data request indicate that market share, as defined by number of customers and annual revenues remained fairly evenly distributed among the same top five wireless companies between December 2000 and June 2002. Wireless subscribership has remained fairly stable over an 18-month period (December 2000 through June 2002). For illustrative purposes, the relative share of customers served by the top five companies is provided in Figures 3.17 through 3.20.
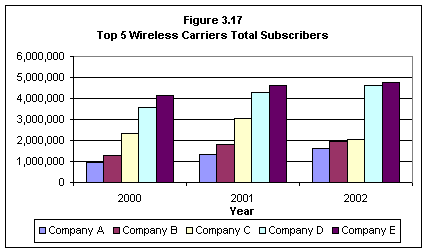
Source: CPUC Wireless Data Request, sent to carriers in August 2002.
2002 subscribership data is through June.
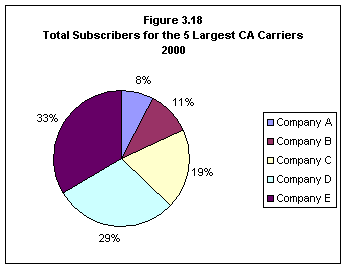
Source: CPUC Wireless DR, sent to carriers in August 2002.
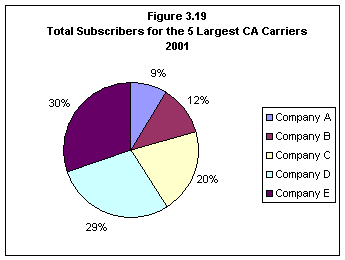
Source: CPUC Wireless DR, sent to carriers in August 2002.
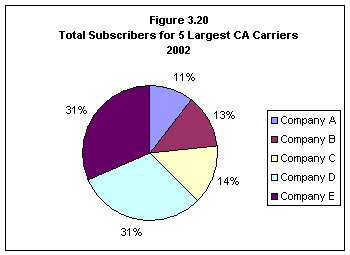
Source: CPUC Wireless DR, sent to carriers in August 2002.
3.2.4 Wireless Industry: Small Wireless Companies
As previously described, five small wireless carriers responded to the CPUC's wireless data request: Cal North Cellular, Cricket Communications, San Diego Cellular, Sure West Wireless, and Working Assets28. The majority of these respondents experienced growth in customers, yet their volume was insignificant compared to that of the top five wireless companies in terms of both subscribers (Fig. 3.21) and revenues (Fig. 3.22).
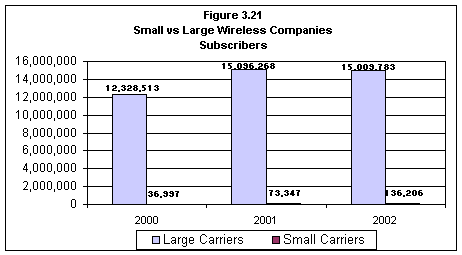
Source: CPUC Wireless Data Request, August 2002.
*2002 data is for the first six months of the year.
Source: CPUC Wireless Data Request, sent to carriers in August 2002.
* 2002 is an annualized estimate based on the first six months of the year. Actual revenues for January through December 2002 were $5,283,054,175 (top 5) and $24,951,623 (5 smaller companies).
3.3 Cross-Sector Comparison: Wireless vs. Wireline Industries
3.3.1 Wireless Industry Growing Faster Than Wireline
Wireline customer statistics were reported in terms of access lines and wireless customer statistics were reported in terms of subscribers. Although the terms are not equivalent, comparing wireline access lines and the number of wireless customers can provide a rough gauge of the relative growth of the wireline and wireless markets29 In December 2000, there were 25 million wireline access lines compared to 12.6 million wireless customers. As of June 2002, there was a significantly greater increase in wireless customers (29% increase to 16.2 million customers) as compared to wireline access lines (2% increase to 25.5 million access lines).
Figure 3.23 Wireline vs. Wireless Growth Comparison | |||
2000 |
2002 |
% Change | |
Wireline (Access Lines) |
25 million |
25.5 million |
2% |
Wireless (Customers) |
12.6 million |
16.2 million |
29% |
Sources: CPUC Wireline and Wireless Data Requests, sent to carriers in July and August 2002.
3.3.2 Fewer Carriers Remitting Surcharges
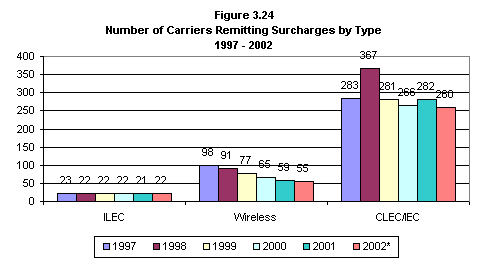
Telecommunications service providers that earn intrastate revenue are obligated to collect and remit surcharges for public programs (such as universal lifeline telephone service) to the CPUC every year. The number of carriers remitting surcharges provides an indication of the number of carriers actually providing service to customers. In an effort to understand changes in the telecommunications industry in California over time, staff reviewed trends in the number of carriers that remitted surcharges to the CPUC.
Source: CPUC surcharge data
* 2002 annualized based on 10 months of data.
Over the six-year period, the number of ILECs that remitted surcharges stayed virtually the same. Over the same period of time the number of wireless has significantly decreased. Although, sharply reduced from its 1998 high point, the number of CLEC/IEC carriers remitting surcharges was only slightly lower
3.3.3 Continued Growth of Billable Revenues
The billable revenue base, or end user billing base, is the amount of retail revenues from which the CPUC collects public program surcharges. The California telecommunications market grew 9.7% from 2001 to 2002 as measured by retail revenues and almost 70% since 1997, from $12.3 billion in 1997 to $20.8 billion (annualized from the first ten months of 2002) in 2002. Most of this growth is a result of increased revenue from wireless services, despite the fewer number of wireless carriers that is remitting surcharges. (See Fig 3.24 above)
3.3.4 Increase in Wireless Assigned Numbers, Decline in Wireline
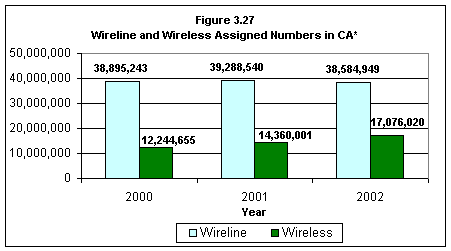
Changes in the amount of telephone numbers assigned to each carrier type in 2002 indicate that California's wireless numbers increased relative to ILEC and CLEC numbers. While wireless assigned numbers grew from 27 percent of California's assigned numbers in 2001 to 31 percent in 2002, both ILECs' and CLECs' share of assigned numbers fell. (See Figures 3.25 and 3.26) Over a two-year period, the wireless assigned numbers have increased 39% to nearly 17.1 million (see Figure 3.27).
- 100% = 53.6 million numbers in 2001 100% = 55.7 million numbers in 2002
Source: Numbering Resource Utilization and Forecast (NRUF)
report produced by the North American Numbering Plan Administrator (NANPA) 9/02.
*As of June of each year
Source: Numbering Resource Utilization and Forecast (NRUF) report produced by the
North American Numbering Plan Administrator (NANPA) 9/02.
3.4 Broadband Communications - Digital Subscriber Line Service
Twenty-two companies registered to provide digital subscriber line (DSL) service in California were sent data requests. Fourteen companies responded that they, either directly or through an affiliate, provide DSL service in California and supplied data, while the remaining eight companies responded that they are no longer in the market.30
3.4.1 ILECs and Affiliates Dominate DSL Market in California
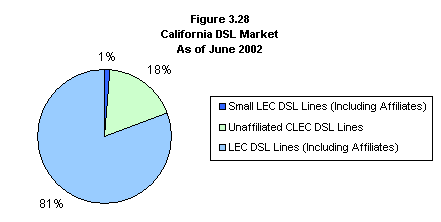
As of June 2002, the two largest ILECs and their affiliated DSL companies account for 81 percent of California's DSL market. These ILECs and their affiliates are: SBC, its affiliate Advanced Solutions Inc. (ASI), Verizon, and its affiliate Verizon Advanced Data Inc. (VADI). The service areas of these phone companies and their affiliates cover the majority of the state, excluding the generally rural areas where service is provided by the state's small ILECs.
Eighteen percent of DSL lines are provided by CLECs that are not affiliated with any of the big ILECs. These providers include companies such as Covad Communications, Focal Communications, Qwest Communications, and Worldcom. The remaining 1 percent of DSL lines in the state is provided by small ILECs operating in less densely populated franchise areas.
Source: CPUC DSL and Wireline Data Requests, sent to carriers in July 2002.
100% = approximately 1.4 million DSL lines
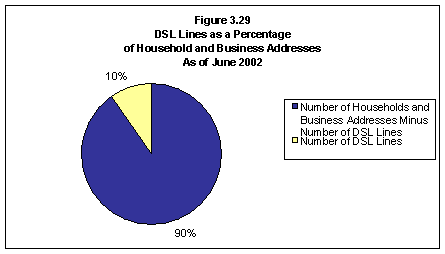
3.4.2 DSL Has Reached 10 Percent of Potential Market in California
As of June 2002, DSL was provided to an estimated 10 percent of all California homes and businesses that have or could have wireline phone service. The data is based on the number of active DSL lines in California compared to the number of residential and business customer sites or households that are DSL capable.31
Source: Year 2000 U.S. Census Data (households)
Source: CPUC DSL and Wireline Data Requests, sent to carriers in July 2002 (DSL lines)
100% = approximately 14.3 million households and business addresses combined
3.4.3 DSL Market Further Evaluated: Retail Residential Market Comprises Majority;
ILECs and Affiliates Dominate in Terms of Revenues
In July 2002, an information request for financial data was mailed to over a thousand carriers, including 27 ILECs, and 717 CLEC/IECs.32 The purpose of the request was to determine market trends based on historical and forecasted financial data.
Responses were received from 174 carriers, of which 62 identified themselves as broadband providers. Of the self-identified broadband providers, 29% were ILECs and ILEC affiliates and 58% were CLEC/IECs. While the financial data responses were often incomplete or deemed confidential, they were valuable in that they confirmed the findings of the CPUC's DSL and Wireline Data Requests noted earlier and identified the major broadband carriers in California. Findings are discussed below..
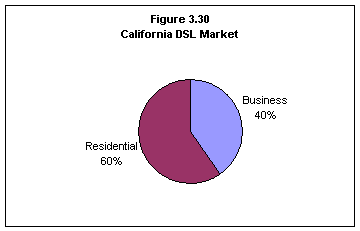
Competitive activity in the DSL broadband market clusters around two distinct market segments at the retail level, the residential market segment and the business market segment. The retail residential market currently accounts for almost 60% of the market in terms of revenues, and carriers estimate that it will account for approximately 70% of the market by 2005. The following chart presents current aggregated revenue by market segment..
Source: CPUC Financial Data Request, sent to carriers in July 2002
100% = approximately $1 billion in total revenue
The residential DSL market is dominated by ILECs and ILEC affiliates. (See Figure 3.31) In addition, ILECs and ILEC affiliates have a substantial presence in the business market. They offer a wide range of services for large as well as small businesses and high-end services at the wholesale level to resellers, large ISPs and to other facilities based IECs and CLECs. ILECs and their affiliates still hold the majority of the business DSL market (see Figure 3.32).
As illustrated in Figure 3.33, ILECs and their affiliates dominate the total DSL market as well as the retail residential and retail business market segments. ILECs and ILEC affiliates account for roughly 81% of the total DSL market based on revenues, the same market share identified in Section 3.4.1 based on DSL access lines.
Source: CPUC Financial Data Requests, sent to carriers in July 2002
Source: CPUC Financial Data Requests, sent to carriers in July 2002
Source: CPUC Financial Data Requests, sent to carriers in July 2002
3.5 Broadband Communications - Cable Modem
276 cable carriers registered in California were sent a request for cable data. Data requested included each carrier's service area, service offerings, and subscribership information for cable television, cable modem and cable telephony services. The data request also sought information on cable carrier network infrastructure. While nine carriers (a 3.6 percent response rate) provided some of the requested data,33 CPUC staff found the data too incomplete to include in this report. Thus, secondary data published by the FCC was selected to present a high-level picture of the cable modem industry in California as compared to the nation. While these reports offer some useful data, they provide a limited picture of cable modem's position in California's broadband market.
3.5.1 Cable Modem Subscribership Grew By at Least 20 Percent Every Six Months in
2000 and 2001
As illustrated in Figure 3.34 below, cable modem lines in California increased 165% between June 2000 and December 2001 from approximately 300,000 to almost 800,000. During this 18-month period, DSL lines in California grew 143% from 370,000 to over 900,000.
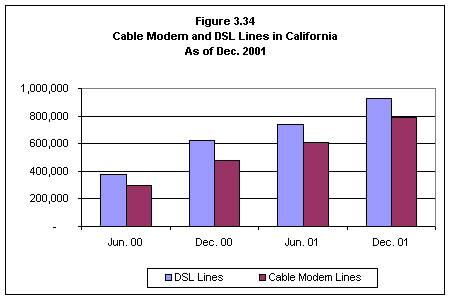
Source: FCC reports: "High-Speed Internet Access: Status as of June 2000,"
"High-Speed Internet Access: Status as of December 2000," "High-Speed Internet Access:
Status as of June 2001", and "High-Speed Internet Access: Status as of December 2001."
Figure 3.35 illustrates trends in the number of cable modem carriers and in subscribership, both in California and nationally. The number of cable modem carriers in California has remained fairly constant from June 2000 through December 2001. Nationally, the number of carriers has increased from 36 carriers in June 2000 to 59 in December 2001. Based on subscribership data, cable modem's share of the overall broadband market appears to be increasing in California - from 33 percent in June of 2000 to 39 percent by December of 2001. The same trend holds nationally, where cable modem's share of the market grew from 52 percent to 55 percent.
Figure 3.35 California and National ADSL and Cable Modem Subscriber Data. | |||||||
ADSL |
ADSL % of Total |
Cable Modem |
Cable Modem % of Total |
Total Broadband Subscribers |
Number of cable modem Carriers | ||
Dec. 01 |
California |
928,345 |
45% |
786,789 |
39% |
2,041,276 |
9 |
% Change |
26% |
29% |
20% |
||||
National |
3,947,808 |
31% |
7,059,598 |
55% |
12,792,812 |
59 | |
% Change |
47% |
36% |
33% |
||||
Jun. 01 |
California |
735,677 |
43% |
609,174 |
36% |
1,705,814 |
8 |
% Change |
18% |
28% |
23% |
||||
National |
2,693,834 |
28% |
5,184,141 |
54% |
9,616,341 |
47 | |
% Change |
36% |
45% |
35% |
||||
Dec. 00 |
California |
622,894 |
45% |
476,544 |
34% |
1,386,625 |
10 |
% Change |
67% |
60% |
52% |
||||
National |
1,977,377 |
28% |
3,576,378 |
50% |
7,106,229 |
39 | |
% Change |
108% |
59% |
65% |
||||
Jun. 00 |
California |
373,574 |
41% |
297,415 |
33% |
909,689 |
8 |
National |
950,590 |
22% |
2,248,981 |
52% |
4,319,365 |
36 | |
Source: FCC reports: High-Speed Internet Access: Status as of June 2000, High-Speed Internet Access: Status as of December 2000, High-Speed Internet Access: Status as of June 2001, and High-Speed Internet Access: Status as of December 2001.
3.6 Cross Sector Comparison: DSL Continues to Outpace Cable Modem in
California, Nationally Cable Modem Ahead of DSL
As of December 2001, DSL continued to outpace cable modem subscribership in California where it constituted 45% of broadband Internet access market as compared to cable modem's 39%.34 Contrary to the national trend, cable modem subscribership trails DSL subscribership in California but it is growing faster than DSL, again, bucking the national trend where DSL growth is faster than cable modem.35 Nationally, cable modem was still the dominant form of high-speed Internet access as of December 2001, constituting 55% of total high-speed Internet access service subscribers while DSL's share was 31%.36
The six-month growth rate for DSL, cable modem, and the overall broadband market slowed considerably in California beginning in December 2000, after growth of more than 50% experienced during the previous six-month period.37 Figures 3.36, 3.37, 3.38, and 3.39 illustrate the relative availability of broadband (DSL and/or cable modem) in California. In contrast to elsewhere in the country, the data shows that in California there is greater access to DSL than cable modem but the deployment of DSL and cable modem technologies has been uneven. Only a quarter of California cities (114 of 475 cities) have a choice between DSL and cable modem forms of broadband. The great majority of California cities have no choice. High-speed access to the Internet through DSL technology (or nothing) is available to 34% of California cites, whereas cable modem access (or nothing) is available to only 18% of California cities. One fourth of California cities do not have access to either type of broadband.
Figure 3.36 California Cities with Broadband Access | ||
Service Type |
Number |
Percent |
DSL Only |
160 |
33.7% |
Cable Only |
86 |
18.1 |
Both DSL and Cable |
114 |
24.0 |
No Broadband Available |
115 |
24.2 |
Total |
475 |
100.0% |
Figure 3.37
California Cities with DSL Access Only
Figure 3.38
California Cities with Cable Modem Access Only Figure 3.39
California Cities with DSL and Cable Modem Access
3.7 Emerging Communications
3.7.1 Wireless Broadband: Limited Information and Deployment
Wireless companies registered in California were asked about the current and planned wireless broadband offerings.
Sprint PCS was the only respondent that currently offers wireless Internet access via fixed wireless technology. Fixed wireless broadband technology uses an antenna placed on or in a building to send and receive data. The data is transmitted to and from the building via a wireless network, which consists of antenna towers placed three to five miles apart. A home or building in a locality that does not receive wireless service will also not be able to receive fixed wireless broadband. Currently, the availability of fixed wireless broadband service is limited, as Sprint PCS indicated that they are not seeking new customers.
Another respondent, T-Mobile, offers wireless networking service using Wireless Fidelity, or WiFi, which uses the unlicensed and unregulated part of the wireless spectrum for sending and receiving information. In addition to Sprint PCS and T-Mobile, the following respondents also report they may offer some form of wireless broadband in the future:
· San Diego Cellular
· Verizon Wireless
· West Coast Wireless
· Working Assets
Of the respondents, most stated that they also plan to offer satellite broadband at an unspecified time.38 Satellite broadband relies on a 24"x36" dish mounted on or near a house or building to send and receive data from satellites orbiting over 20,000 miles above the Earth.39 At this time, satellite broadband is primarily utilized by residential users. Business usage is limited by network installation necessary to facilitate shared connections in office environments.
3.7.2 Internet Protocol Technologies
While the Internet is used today primarily as a vehicle to transport information, converging data and voice traffic for movement over the Internet backbone can promote efficiencies that translate into a potentially lower cost telecommunications alternative to the use of the conventional circuit-switched network. Thus, a small but growing amount of telephone voice traffic is migrating, in whole or in part, from the public switched telephone network (PSTN)40 to the Internet for transport via newly developed packet-based protocols.41 This new mode of voice transport is termed Internet Protocol telephony, or simply IP telephony. The pace of development of IP telephony applications has been impacted by two factors:
· Incumbent telephone service providers cannot quickly abandon their legacy (circuit-switched) infrastructures because these assets represent substantial capital investment.
· The new IP technology cannot yet achieve the near perfect service reliability and quality standards that PSTN users have come to rely upon.42
The nature of present IP telephony applications varies greatly. One of the fastest growing uses of IP telephony is for building private business voice communications networks to serve the needs that more mainstream PBX systems43 once satisfied.44 In another application, long distance telecommunications companies that own parts of the Internet backbone are beginning to move interexchange voice traffic over these facilities, using only the local part of the PSTN at each end of a call. In yet another IP telephony application, a handful of new telecommunications companies are offering combined local and long distance telephone service to customers who have high speed Internet connections (DSL or cable modem). Calls are made and received through a network translator device connected between the telephone equipment and the Internet connection. The customers' telephone numbers are assigned without regard to geographic location,45 and the only part of a call that moves over the PSTN (except for the part that rides on the local loop in the case of DSL) is the part necessary to originate or complete the transmission to or from a non-customer that has conventional service.
As IP telephony evolves, it may in the future have a particularly significant competitive influence on California's local telecommunications market. For example, the cable infrastructures of CATV providers reach extensively into the residential areas of California communities. But even though CATV providers have this access to telephone customers, they often do not now market local telephone service extensively with their other offerings because of the cost of investing in and maintaining switches. A high voice quality IP telephony technology will present a relatively low cost solution to this economic barrier, and thus create a better environment for CATV providers to bundle telephone service, Internet information access and CATV service.
Another facet of the evolution of IP telephony is that it may present regulatory policymakers with some vexing issues to resolve. As historically regulated voice transmission increasingly converges with the unregulated distribution of information service, significant regulatory boundaries are being blurred. To the extent IP telephony continues to grow and is allowed to bypass the regulatory regime because of this convergence, funding now supplied from revenues produced by regulated telecommunications supplied over the PSTN for programs that subsidize telephone service to rural areas, telephone service for the poor, and Internet service access for schools and libraries will diminish. New funding sources for these programs will have to be developed if they are to be sustained.
Chapter 4. Regulatory Issues Impacting Telecommunications
Chapter 4 of the report discusses key regulatory issues impacting the competitive telecommunications landscape in California. These issues include economic, regulatory, and consumer-oriented concerns. Topics include long distance market entry, service quality, California's Consumer Bill of Rights, number portability, Unbundled Network Element (UNE) prices, Unbundled Network Element Platform (UNE-P), and proceedings affecting competition.
4.1 SBC Commences Long Distance Service in California
On September 19, 2002, the Commission issued an advisory decision to the FCC on SBC's compliance with the 14-point checklist in Section 271 of TA 96. In particular, the Commission found SBC had successfully passed the independent third-party test of its Operations Support System (OSS)46 and had substantially satisfied twelve of the fourteen Section 271 criteria47. However, pursuant to Public Utilities Code 709.2, which requires the Commission to make four specific determinations before implementing an "order authorizing or directing competition in intrastate interexchange telecommunications", the Commission concluded that SBC's entry into the California long-distance market would not be in the public interest.
In the September decision, the Commission affirmed that SBC's competitors have "fair, nondiscriminatory, and mutually open access' to SBC exchanges, as required by Section 709.2(c)(1), but also found that the existing record could not support affirmative determinations of "no anticompetitive behavior" and "no improper cross-subsidization" as required by Sections 709.2(c)(2) and (3), respectively. The decision held further that SBC's entry into competitive intrastate long-distance telephone markets posed "a substantial possibility of harm" to those markets, contrary to Section 709.2(c)(4).
After convening a prehearing conference and considering additional comments from the parties in the case, the Commission revisited 709.2 concerns in a December 30, 2002 decision. In this decision, the Commission determined that additional safeguards would provide significant mitigation against potential SBC anti-competitive behavior.
SBC formally petitioned the FCC for permission to sell long-distance in California on September 20, 2002 and received FCC approval on December 19, 2002. Having satisfied requisite federal and state requirements, SBC's entry into the long distance market may provide California consumers the benefits of increased competition. The number of proactive safeguards, monitoring efforts and enforcement tools at the disposal of federal and state regulators will help ensure that the benefits are delivered.
4.2 SBC's Performance Incentive Plan: To Assure That CLEC Customers Receive
the Same Service as ILEC Customers
Anticipating SBC's eventual entry into California long distance markets, in March 2002, the Commission adopted a Performance Incentive Plan (PIP) to help assure SBC will provide the same level of service to its CLEC customers in the local market as it does to its own customers. The PIP establishes a mechanism to measure SBC's performance and make adjustments to the rates SBC charges the CLECs and ratepayers for local exchange service and OSS services. Poor performance, identified by statistical standards or benchmarks, leads to monetary amounts that SBC must credit to CLECs and ratepayers. Implemented in April 2002, the PIP identifies the payment for sub-par performance results, how any payments made will be increased if performance worsens, and how they will be shared between the CLECs and the ratepayers. During the first five months of the plan's implementation, April through August 2002, SBC credited almost $4.8 million back to CLECs and ratepayers (Figure 4.1). Based on the credit assessment formula, approximately 70 percent of the credits went to the CLECs.
The PIP serves to motivate SBC to improve its performance results and improve trouble-shooting when performance problems occur. The Commission has recently initiated a PIP review, as part of its strategy, to periodically work with SBC and CLECs to achieve change.
Figure 4.1 Performance-Based Incentive Credit Amounts Paid by SBC (April - November 2002) | |
Credited To |
Total |
CLECs |
$3,292,113 |
Ratepayers |
$1,455,864 |
Total |
$4,747,977 |
Source: Performance Incentives Plan Implemented in April 2002.
4.3 Unbundled Network Element Pricing and Policies: Contentious Issues Under
Review
4.3.1 SBC and Verizon UNE Proceedings
ILECs provide the Unbundled Network Element Platform (UNE-P)-a combination of unbundled loops, switches and transport elements-as a means for CLECs to provide local service. The CPUC is reviewing SBC and Verizon's UNE rates in separate concurrent proceedings. At present, staff is becoming informed on the cost models submitted by parties, after which the Commission will determine the appropriate models to cost out the UNEs under consideration. An interim decision for the Verizon proceeding is expected within the first quarter of 2003 and in the second or third quarter of 2003 for the SBC proceeding.
4.3.2 The FCC Triennial Review
In December 2001, the FCC opened an investigation into its UNE policies including the UNE-P, with the goal of "maintain[ing] the proper balance between requiring incumbent LECs to unbundle their facilities and encouraging other carriers to invest in alternatives. 48" It is a contentious issue; with ILECs and CLECs actively campaigning in the media and trying to apply pressure on regulators to promote their point of views on the issue. The CPUC's position, as set forth in comments to the FCC triennial review, is that current unbundling rules should be continued as fair access and prices are critical to telecommunications competition. An FCC ruling is expected by the end of the first quarter of 2003.
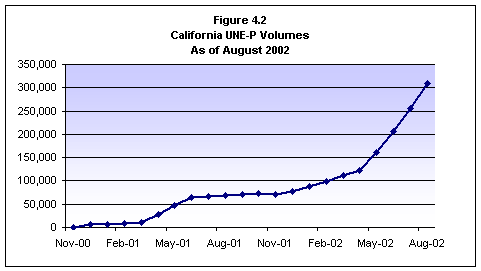
Figure 4.2 shows that UNE-P volumes exhibited negligible growth between November 2000 and March 2001. CLECs broke through the 10,000 UNE-P order mark in March 2001, when the CPUC instituted an examination into SBC's loop and switch-port rates. The number of UNE-P lines in California continued to grow steadily but slowly through early 2002, when in February 2002 the 100,000 mark was reached. On May 16, 2002, the CPUC issued a decision lowering SBC's UNE prices and, months later in August 2002, AT&T began providing residential local service in California. The 300,000 UNE-P lines mark was reached in August 2002, a great improvement over prior periods but still low in comparison to the estimated 25.5 billion access lines in California.
Source: CPUC Wireline Data Request, July 2002.
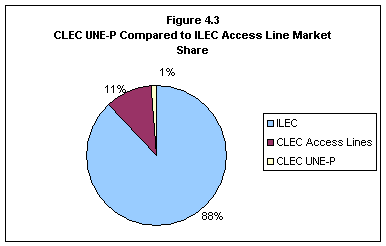
The above graph shows that lower UNE-P prices lead to increased growth in CLEC UNE-P lines. Figure 4.3 below shows, however, that CLECs have captured only 12 percent of the total access line market and only 1.2 percent of the total access lines in California are CLEC UNE-P lines.
Source: CPUC Data.
4.4 Local Number Portability: Of Growing Importance to CLEC Market Share
4.4.1 Switching Phone Numbers: A Barrier to Competition
In an openly competitive telecommunications marketplace, consumers need to be able to choose and move freely among multiple telecommunications service providers. Especially in the local telephone market, consumers may be deterred from switching to a new service provider if switching requires consumers to assume a new phone number. Congress, the FCC, and the CPUC addressed this problem by requiring most wireline phone companies to allow customers to switch between phone service providers while retaining their original telephone number.49 The process of switching is called number porting.
4.4.2 NUMBER PORTING ACTIVITY DOWN FROM LAST YEAR
LOCAL PHONE NUMBER PORTING AMONG WIRELINE CARRIERS BEGAN IN CALIFORNIA IN MAY 1998. AS OF JULY 2002, 37 LOCAL SERVICE PROVIDERS (THREE ILECS AND 34 CLECS) WERE ON RECORD AS ACTIVE PARTICIPANTS IN NUMBER PORTING, EITHER HAVING LOST CUSTOMERS THAT HAD TAKEN THEIR NUMBER TO A COMPETITIVE PROVIDER, OR HAVING GAINED CUSTOMERS THAT HAD BROUGHT THEIR NUMBER WITH THEM. THE NUMBER OF PORTS HAS DROPPED DRAMATICALLY SINCE LAST YEAR AND REVERSES A TREND OF INCREASED PORTING. IN JULY 2001, 1.9 MILLION PORTS, NEARLY 5 PERCENT OF THE LOCAL MARKET, WERE IN EFFECT. THIS YEAR AS OF JULY 2002, JUST OVER 900,000 PORTS, OR 2.5 PERCENT OF THE LOCAL MARKET, WERE IN EFFECT.
Consistent with last year's data, number porting is none-the-less more critical to CLECs than to ILECs competing in the state and, thus, the CPUC supports its continued use. Most number porting is used to enable customers to leave ILECs in order to take service from a CLEC. While ported customers account for a small net loss to ILECs, they constitute a significant, but shrinking, share of the CLEC customer base. In July 2001, over 1.6 million numbers were ported to CLECs, comprising 29 percent of CLEC assigned customers. By July 2002, less than 800,000 numbers were ported to CLECs, comprising only 16 percent of CLEC assigned customers. If number porting were not available, CLECs would presumably lose 16 percent of their local market share.50
Since number porting is generally beneficial to CLECs, the drop in number porting indicates that CLECs as a group are not doing as well in gaining market share as they were last year. Since last year, five new CLECs have begun porting in customers. However, seven CLECs that last year had a net gain of customers from porting are out of business or losing more customers than they gain. Of the remaining CLECs, 16 have fewer ported customers than they had last year.
4.5 Wireless Number Portability: Critical to Competition and Consumer
Choice
Wireless number portability will allow wireless customers to retain their phone number when switching to a new service provider, whether wireline or wireless. The FCC has extended the deadline for implementation of wireless number portability several times and the current deadline is November 24, 2003.51 Verizon Wireless had petitioned the FCC to permanently forbear from the number portability requirement for wireless carriers. While the FCC declined this request, it did grant the wireless carriers a one-year extension of the previous deadline of November 24, 2002. However, Verizon Wireless and the Cellular Telecommunications and Internet Association (CTIA) have appealed the FCC order to the D.C. Circuit Court of Appeal on the basis that the FCC's mandate violates Section 10 of the Communications Act. The Court has yet to act on the appeal.
The CPUC supports wireless number portability because it is likely to increase competition in the wireless industry, as well as between the wireline and wireless industries. Furthermore, consumers have expressed a desire to be able to switch wireless phone providers without surrendering their phone number. This will force wireless providers to offer lower prices and better packages to keep existing or to attract new customers.
4.6 CALIFORNIA TELECOMMUNICATIONS CONSUMER BILL OF RIGHTS
4.6.1 A STRONGER ROLE FOR THE CPUC IN CONSUMER PROTECTION
On February 3, 2000, the CPUC opened an Order Instituting Rulemaking (OIR) to establish consumer rights and consumer protection rules applicable to all telecommunications utilities (R. 00-02-004). This rulemaking, which began this proceeding, introduced the Telecommunications Division staff report on consumer protections for a competitive telecommunications industry. This report found that consumers, and ultimately the competitive market, would benefit from clear rules. In summary, the staff's four recommendations were:
1. Establish consumer protection rules
2. Apply consumer protection rules to wireless carriers
3. Revise competitive service tariffs with consumer protection rules
4. Review carriers' limitation of liability language to insure consumer protections
Between mid-June and September 2000, the Commission held 20 public participation hearing sessions and garnered as much input as possible from consumers. As a result, some 1,200 people attended, more than 300 made public statements, and another 2,000 made their views known by letter or e-mail. The general public sentiment was overwhelmingly in favor of the Commission's taking on a much stronger consumer protection role.
On June 6, 2002, the California PUC released its draft interim decision and draft general order, which detailed the proposed rules governing telecommunications consumer protection.
4.6.2 Landmark Bill of Rights for California Developed by the CPUC
The California Telecommunications Consumer Bill of Rights is based on the principle that consumers who interact with telecommunications providers should be afforded certain basic rights, and the telecommunications providers with whom they do business must respect those rights. Judging from the increasing number of complaints made by Californians to the Commission, consumers need more effective protections as we move towards a more competitive telecommunications market. This bill attempts to consolidate and simplify existing consumer protections, currently found in many different Commission tariffs and rules, and proposes new protections not currently provided. A copy of this rulemaking can be found at the following website:
The rights proposed in the rulemaking include:
Disclosure: Consumers have a right to receive clear and complete information about rates, terms and conditions for available products and services, and to be charged only according to the rates, terms and conditions they have agreed to.
Choice: Consumers have a right to select their services and vendors, and to have those choices respected by the industry.
Privacy: Consumers have a right to personal privacy, to have protection from unauthorized use of their records and personal information, and to reject intrusive communications and technology, (e.g., telemarketing, automated dialers, and junk-mail faxes).
Public Participation and Enforcement: Consumers have a right to participate in public policy proceedings, to be informed of their rights and what agencies enforce those rights, and to have effective recourse if their rights are violated.
Accurate Bills and Redress: Consumers have a right to accurate and understandable bills for products and services they authorize, and to fair, prompt, and courteous redress for problems they encounter.
Non-Discrimination: Every consumer has the right to be treated equally to all other similarly situated consumers, free of prejudice or disadvantage.
Safety: Consumers have a right to safety and security of their persons and property.
Development and implementation of the Bill of Rights is an on-going process for Commission staff. Four days of structured workshops were followed by collaborative meetings between carriers, law enforcement and consumer groups to work through issues and develop consensus recommendations where possible. Staff in preparation for a final draft of the proposed rules is currently analyzing written comments from parties in the proceeding. Staff is also making preparations for implementation of the rules upon their adoption by the Commission.
4.7 Quality of Service
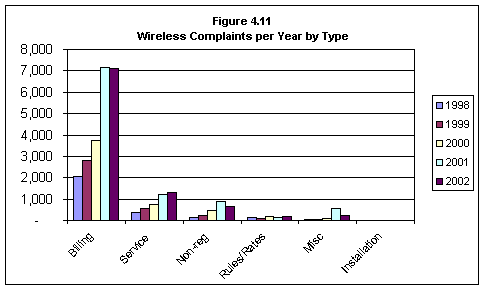
Customer complaints relating to wireline, wireless, and DSL services are critical barometers of market efficiency. In a healthy marketplace, service quality would be maintained to attract and retain customers. This is not happening, as the CPUC receives a significant number of complaints, increasingly in regard to billing dispute concerns.
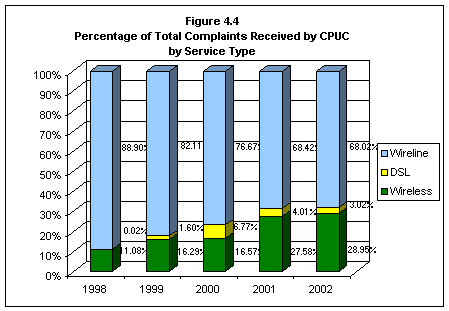
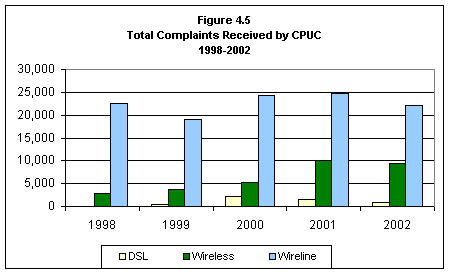
As telecommunications services have increased and diversified, the numbers of complaints have changed accordingly. Wireline complaints represented a decreasing portion of all complaints, whereas those relating to wireless have nearly tripled in their share of total complaints. (See Figure 4.4). DSL related complaints have varied greatly, increasing through 2000, then decreasing through 2002 (see Figure 4.5).
Source: CPUC, Consumer Affairs Branch
Source: CPUC, Consumer Affairs Branch
Complaints received by the CPUC are categorized as:
4.7.1 Wireline Complaints: Almost 113,000 in 5 Years, Billing Complaints Account for
Half
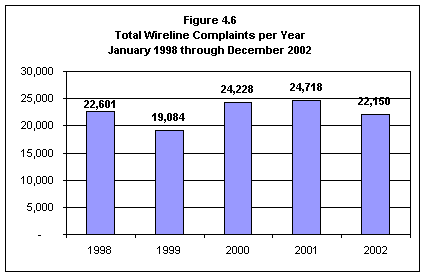
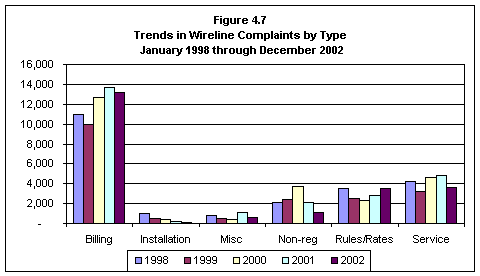
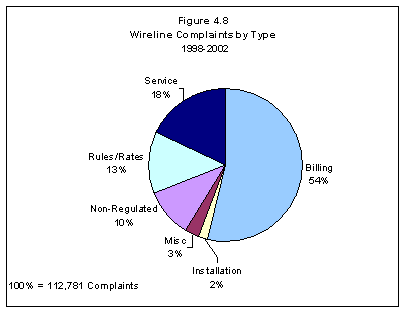
From January 1998 through December 2002, the CPUC received almost 113,000 complaints about wireline carriers. An annual breakdown is provided in Figure 4.6. The top three areas of wireline complaints in these years have been billing, service, and rule/rates, respectively. Billing complaints have generally increased over this period. (See Figure 4.7). From 1999 to 2002, billing alone has represented over 50% of all wireline complaints (see Figure 4.8).
Source: CPUC, Consumer Affairs Branch
Source: CPUC, Consumer Affairs Branch
Source: CPUC, Consumer Affairs Branch
When totaled over the 5-year period, the proportion of complaints per type mirrors those received in individual years. Namely, billing complaints lead by a huge margin (54%), with service (18%) and rules/rates (13%) complaints following. While the number of non-regulated complaints fell between 2000 and 2002, they still represented about 10% over this period.
4.7.2 Wireless Complaints: Over 31,000 in 5 Years
Between 1998 and 2002, the CPUC received more than 31,000 complaints from Californians about their wireless service. The number of total complaints has risen since 1998, with the largest increase occurring between 2000 and 2001. Complaints received between 1998 and 2001 rose by 254%. Although the number of wireless complaints received during 2002 declined slightly, its order of magnitude was closer in similarity to 2001 (see Figure 4.9).
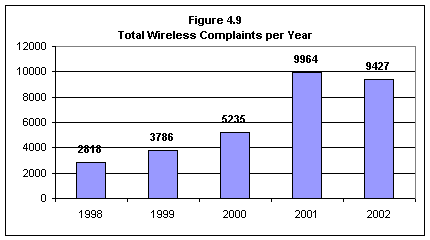
Source: CPUC, Consumer Affairs Branch
Figures 4.10 and 4.11 below show total wireless complaints the CPUC has received over the past five years. On a yearly basis, the percentage of complaints in each of the six categories has stayed roughly the same over the past 5 years. Similar to wireline complaints, billing and service were consistently the two largest categories of wireless complaints. Almost 23,000 billing complaints and nearly 4,200 service complaints were received during this period. The four remaining categories combined amounted to about 4100 complaints. 2001 saw the biggest increase in complaints from the previous year.
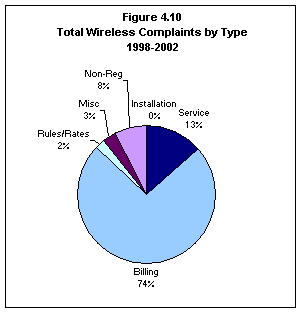
Source: CPUC, Consumer Affairs Branch
Source: CPUC, Consumer Affairs Branch
4.7.3 DSL COMPLAINTS: OVER 4,900 IN 5 YEARS
The CPUC has received over 4,900 complaints about DSL from California consumers during the past 5 years from 1998 through 2002. Between 1998 and 2000 as the rate of DSL deployment increased, so did the number of complaints. Conversely, the declining number of complaints received subsequent to 2000 may have been related to a declining rate of deployment. (See Figure 4.12).
Figure 4.12 DSL Complaints by Year, 1998 - 2002 | |
Year |
DSL Complaints |
1998 |
4 |
1999 |
373 |
2000 |
2,138 |
2001 |
1,447 |
2002 |
985 |
Total |
4,947 |
Source: CPUC, Consumer Affairs Branch
Over the past 5 years, DSL complaints received by the CPUC have transitioned from being predominantly about service to being predominantly about billing. In 1999, 95% of the DSL complaints filed by Californians were about service, installation, and billing. By 2001, complaints about billing and service accounted for about 87% of total DSL complaints received that year. Billing and service complaints comprised 93% of the total complaints received in 2002.
Billing complaints have risen from 11.6% to 75.3%. On the other hand, both service and installation complaints have declined (from 59.1% to 17.6% and 24.3% to 2.4%, respectively) during the past 5 years. (See Figure 4.13). Although the providers of DSL service have gotten better at installation and service, billing needs much improvement based on what Californians are telling the CPUC.
Figure 4.13: DSL Complaints as % of Total | ||||
1999 |
2000 |
2001 |
2002 | |
Billing |
11.6% |
22.5% |
57.7% |
75.3% |
Installation |
24.3% |
22.7% |
5.6% |
2.4% |
Miscellaneous |
0.6% |
0.8% |
0.9% |
0.9% |
Non-Regulatory |
2.8% |
3.9% |
3.6% |
2.3% |
Rates/Rules |
1.7% |
0.7% |
2.6% |
1.6% |
Service |
59.1% |
49.4% |
29.6% |
17.6% |
Source: CPUC, Consumer Affairs Branch
DSL complaints totaled for the past 5 years, as shown in Figure 4.14, portray a similar story as the past two years. On an aggregated basis, billing represents 42%, service with 38%, and installation with 14% of the total complaints received since 1998.
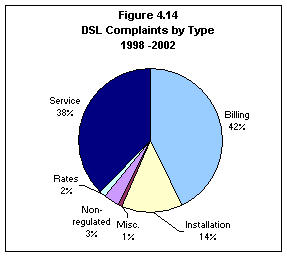
Source: CPUC, Consumer Affairs Branch
4.7.4 CPUC Opens Docket to Address Service Quality Standards
In early December 2002, the Commission opened a proceeding to revise the ten-year-old standards it has been using to judge telecommunications service quality. The action was necessitated because of the evolution of telecommunications technology and changed business conditions.
This proceeding will establish rules for all carriers providing retail telecommunications products or services to end users in California, including DSL and wireless providers. It will also establish more uniform procedures for measuring and reporting service quality. Specifically, the proceeding will establish:
· Rules for when automated menus are used to respond to customers' calls and to allow access to a company representative.
· Standards for installation and repair of primary telephone lines, additional telephone lines, DSL lines, and other services.
· Higher standards and enforcement mechanisms such as penalties and customer credits that ensure carriers provide high quality service to Californians.
· Additional technical and consumer impact measures and reports that are needed to adequately measure service quality.
· A requirement for all carriers to report major service outages.
· Reporting requirements that will help the Commission measure the effectiveness of its consumer protection rules.
Unless a need arises for the Commission to conduct public hearings on any of these matters, a final decision adopting revised rules is expected in the fall of 2003.
4.8 Competition in Small ILEC Service Areas
The Commission plans to look at the feasibility of opening competition in small ILEC markets, as well as the associated issues that must be addressed. The issue expected to be at the center of this discussion is ratemaking. Small ILECs' rates are currently set to cover their respective costs of service, which may not allow the pricing flexibility necessary to compete in an open market. On the other hand, the regulatory framework employed for large ILECS may not be suitable for small ILECs. Development of a new regulatory structure for small ILEC's will likely be required.
4.9 Federal Proceedings Impacting Broadband Competition
Since broadband technologies, services, and regulations are still maturing, there are several ongoing proceedings that seek to clarify the legal and regulatory frameworks surrounding broadband services. Of the many FCC proceedings underway, there are several that will have significant impact on the broadband industry and marketplace.
4.9.1 Triennial UNE Proposed Rule
In December of 2001, FCC initiated its triennial review of its Unbundled Network Elements (UNE) to determine if it needs to modify its rules concerning what UNEs must be made available to CLECs by ILECs, and in what manner those UNEs should be made available. The triennial UNE NPRM (Notice of Proposed Rulemaking) comment cycle closed on July 17, 200258.
The NPRM seeks to identify more precisely how incumbent local exchange carriers must provide competitors access to their ubiquitous networks. The NPRM also seeks comment on how the Commission's unbundling rules may best foster the Act's goals, including promotion of competition, deployment of advanced broadband services, and incentives for investment in facilities. Specifically, this inquiry requests input on how the Commission should refine its unbundling analysis.
In its comments to the FCC, the CPUC urged the FCC to keep the existing UNE rules and the list of UNEs intact and not restrict the state's ability to add additional UNE(s) to meet the unique market and industry conditions of each state. The FCC has yet to issue a final ruling on this proceeding.
4.9.2 ILEC Broadband Proposed Rule
In December 12, 2001, the FCC initiated a review of the current regulatory requirements for ILECs' broadband telecommunications services. In the Review of Regulatory Requirements for Incumbent LEC Broadband Telecommunications Services NPRM, the FCC is considering whether an ILEC's broadband service offerings should be subjected to the FCC's numerous regulations, such as tariff filing and pricing requirements, that apply to service offering from a dominant carrier. Currently, an ILEC is automatically treated as the dominant carrier in a service market, broadband included, absent a specific finding to the contrary.
This NPRM seeks comments on what changes, if any, the FCC should make to these traditional regulatory requirements as applied to ILECs' broadband telecommunications services. The FCC wants to ensure that the proper incentives for broadband growth and investment are in place, and to ensure that its rules reflect the current competitive landscape, in particular, the level of competition due to the existence of intermodal competitors, such as cable, wireless, and satellite providers. The comment cycle closed on April 22, 2002. In its comments, the CPUC urged the FCC to keep the current regulatory regime in place. The CPUC argued that the current broadband competitive landscape is still dominated by ILECs and intermodal competition is still far from vibrant and ubiquitous.
4.9.3 Broadband Proposed Rule
On February 14, 2002, the FCC initiated a proceeding from which it hope to develop and adopt regulation that will promote the ubiquitous deployment of broadband technology by carriers. In this NPRM, the FCC tentatively concluded that wireline broadband Internet services were "information services with a telecommunications component, rather than telecommunications services." If this classification stands, ILECs would be freed of some of the most important regulatory obligations critical for the promotion of competition in the broadband marketplace, which includes the ILEC unbundling requirement for the offering of broadband services by CLECs.
In this NPRM, the FCC seeks comment regarding the appropriate legal and policy framework for broadband access to the Internet provided over domestic wireline facilities, consistent with the Telecommunications Act of 1996. The comment cycle for this NPRM was closed on July 1, 2002.
In its comments to the FCC, CPUC argued that there has not been enough change since the passage of the 1996 Telco Act and the FCC's adoption of the unbundling requirement to warrant the classification that ILECs no longer control the bottleneck facilities for the provisioning of broadband services. CPUC urged the FCC to maintain its current classification of ILEC broadband services as telecommunications services. The FCC ruling is pending and expected to be issued by the first quarter of 2003.
4.9.4 Internet Over Cable Proposed Rule
In a NPRM released on March 14, 2002, FCC issued a ruling that cable modem is an interstate information service and is subject to FCC jurisdiction. This ruling would keep cable modem service provider free of some obligations and regulatory burdens currently faced by ILECs when they provide broadband services. This ruling has been challenged by CLECs and other local government agencies, including the CPUC, in the federal court.
Based on this ruling, FCC seeks comments on four areas to better examine the impacts of its ruling. One, should there be different FCC regulatory treatment between wireline broadband and cable modem service. Two, the scope and limitation of FCC's jurisdiction over cable modem. Three, is it necessary or appropriate to require open access of cable network. And four, what roles should state and local governments play in the regulation of cable modem service.
In its comments, the CPUC urges the FCC to adopt an open access regulatory framework for cable modem in order to better promote competition and lower consumer costs. The CPUC argues that cable modem service, when provided by a facilities-based carrier, is a hybrid service, comprised of a common carrier transmission service component and an information service component. CPUC believes, further, that the transmission service component is a bottleneck facility (when provided by a facilities-based carrier) that should remain subject to common carrier regulation to ensure just, reasonable and nondiscriminatory terms and conditions of service.
The CPUC has additionally joined in a Federal Court appeal challenging the FCC's ruling on this mater.
4.10 State Regulatory Proceedings Impacting Competition
There are also several proceedings in front of the CPUC that impact the competitive landscape in California.
4.10.1 ASI/SBC 851 Asset Transfer
The CPUC is reviewing SBC's application to transfer some of its assets to its corporate affiliate, Advanced Solutions, Inc. (ASI) under Public Utility Code Section 851. In response to oppositions and legal, regulatory and economic issues raised, this application has been stayed three times at the request of SBC.
Although SBC decided finally to go ahead with the application, the record has become stale since the last hearing in 2000. Accordingly, the Commission ordered SBC to update and resubmit its application. SBC has resubmitted its application and the case is currently pending in front of the Commission.
4.10.2 Broadband as a Basic Service
In carrying out the requirements of Senate Bill 1712, CPUC has opened a proceeding to investigate the feasibility of including broadband service in the definition of "basic service" used for universal service programs and be eligible for public subsidy.
On August 14, 2002, the CPUC issued a report detailing the findings of its investigation. The report concludes that while the Commission believes it has the authority to include broadband in its definition of basic service, its investigation did not find popular desire or demand for the commission to do so.
4.10.3 Proposed Legislation
In 2002, the United States Congress considered several broadband related bills. The Tauzin-Dingell bill would allow the ILECs to offer broadband services without making its network available to competitors to offer similar services, in contrast with requirements in the 1996 Telecommunications Act. It would also preempt most state broadband regulation and was opposed by both the National Association of Regulatory Utility Commissioners (NARUC) and the CPUC. After passing the House of Representatives, the bill was not brought to a vote before the Senate panel reviewing the bill. The proponents of the bill have indicated that they will try again in a subsequent session of the Congress.
In the U.S. Senate, the Breaux-Nickles bill (Broadband Regulatory Parity Act of 2002) would require the FCC to develop and implement policies, within 120 days, to remove regulatory constraints on the ILECs' broadband offering in order to achieve regulatory parity between DSL and cable modem services. This bill remains pending in the Senate and would also preempt state regulation of broadband services.
Sen. John McCain introduced the "Consumer Broadband Deregulation Act of 2002" on Aug. 1, 2002. One of the main purposes of this bill is to deregulate residential broadband service by prohibiting FCC and state governments from imposing new regulations or open access requirement on broadband service providers, other than for consumer protection purpose. However, this bill will not deregulate broadband service serving business customers, which is in contrast to Breaux-Nickles, the other Senate broadband deregulation bill.
4.10.4 Legal Activities
The CPUC has appealed the FCC's Declaratory Ruling on cable modem service to the Ninth Circuit Court of Appeals. As previously noted in the earlier Section entitled, "Internet Over Cable Proposed Rule" the CPUC believes that cable modem service, is a bottleneck facility (when provided by a facilities-based carrier) that should remain subject to common carrier regulation to ensure just, reasonable and nondiscriminatory terms and conditions of service.
The U.S. Court of Appeal in Washington D.C. has remanded for reconsideration two key pieces of FCC regulation with regard to UNEs. The Appeals Court ordered the FCC to reconsider and justify its standard for requiring the ILECs to unbundle an UNE and make it available to the CLECs.
The U.S. Supreme Court rejected arguments raised by ILECs and ruled in favor of FCC in the UNE pricing methodology it uses (Total-Element Long-Run Incremental Cost - TELRIC) to set the cost of UNEs ILECs must make available for lease by CLECs. The court rejected the ILECs' arguments that TELRIC pricing methodology amounted to taking without just compensation.
4.10.5 Competition Report
The Legislature enacted Section 316.5, which directed the CPUC to issue an annual competition report beginning October 31, 2001. This statute will sunset on January 1, 2004. Accordingly, the CPUC expects to issue one more competition report before the January 1st statutory deadline. Should the Legislature find the CPUC competition reports to be a valuable source of telecommunications competition data, legislation and funding will be needed for this report to continue.
24 ILEC affiliates operate in California as CLECs, but to more fully assess ILEC market share, affiliate revenues are included in ILEC revenue figures. The following ILEC affiliate revenues were included in ILEC revenue: Cal-Ore LD, Cal-TEL LD, Citizens Telecom (IEC), Pinnacles LD, SBC Advanced Services Inc., SierraTel LD, Siskiyou LD, SureWest Broadband, Verizon Advanced Data, Verizon Enterprise, Verizon LD, Verizon Select Services, and Volcano LD
25 Respondents: Top 5 firms (not in order) were Nextel, Cingular (SBC), Sprint PCS, Verizon Wireless, AT&T Wireless. Smaller firms (not in order) were Cal North Cellular, Cricket Communications, San Diego Cellular, Sure West Wireless, Working Assets.- Staff also talked with WorldCom, which was the largest reseller in California and had approximately 300,000 customers in California in 2002. Bankruptcy and reorganization proceedings in 2002 led to their departure from the wireless market. WorldCom resold the services of AT&T Wireless (85%), Sprint PCS, Verizon Wireless, and Cingular. The company is in the process of transferring resale customers back to the facilities-based parent companies, with the exception of Sprint PCS customers who will be transferred to another reseller.
27 Numbering Resource Utilization and Forecast (NRUF) report published by the North American Numbering Plan Administrator (NANPA) 9/02.
28 These carriers are not necessarily representative of the wireless carrier population, excluding the top five carriers. In addition, two of the five small carriers did not report all data for the period. Their information is presented, however, to illustrate the relative market share difference between small and large wireless carriers.29 Access lines, which are indicative of network infrastructure holdings and may double count customers, are not equivalent to customers although a comparison was still made to get a sense for relative changes over time.
30 Incomplete data responses to the DSL data request were supplemented, where possible, with information contained in responses to the wireline data request. 31 The universe of all DSL eligible locations in California includes home offices that may be double counted and households may contain more than one customer. . 32 The survey was sent to all California ILECs, CLECs, IECs and cellular carriers. Some cable companies and fixed wireless providers were registered as either CLECs or IECs. Satellite providers are not registered by the CPUC and, consequently, were not included in the survey. 33 Cable carriers that responded to the CPUC cable data request: AT&T, Cox Communications, Adelphia, Time Warner, San Simeon Community Cable, Seren Innovations, RCN Telecom Services, Inc., NPG Cable, Cable America 34 FCC, "High-Speed Services for Internet Access: Status as of December 31, 2001." 35 In June 2001, cable modem subscribership grew by 28% over December 2000, while DSL growth over the same period is 18%. In December 2001, cable modem subscribership increased 29% over the preceding six months, while DSL grew 26%. 36 FCC, "High-Speed Services for Internet Access: Status as of December 31, 2001." 37 FCC, Status as of June 2000, December 2000, June 2001 and December 2001. 38 Nextel and AT&T Wireless did not respond to the advanced services questions in regard to either fixed, WiFi, or satellite forms of wireless broadband services. 39 An antenna both sends requests to the Internet and receives Internet content via the satellite and is managed from a service provider's hub facility, which connects to the Internet either directly or through an Internet Service Provider (ISP). The same dish may be used for satellite TV, depending on the service provider's offering. 40 PSTN simply refers to the local, long distance and international phone system which we use every day. In some countries it is only one phone company, in countries with competition (e.g. - the United States) PSTN refers to the entire interconnected collection of local, long distance and international phone companies, which could be thousands. 41 Packet based systems are those in which transmission is accomplished digitally in multiple, three part segments. Each segment contains a header (with control information), a payload (containing the actual transmitted information), and the trailer (signaling the end of the packet and containing error detection and correction bits). 42 Both the PSTN and IP telephony use packet-based digital transmission technology. In the case of circuit-switched networks, however, a dedicated circuit between the end points of each voice call is established that allows the sequenced stream of packets to move together over a single route. In the Internet environment, the multiple packets of a transmission - voice call related or otherwise - travel through the Internet independent of one another. Each packet may be sent by a different route across the Internet to be reassembled at the end point. If any packets are reassembled into the whole out of sequence or are lost, transmission quality or reliability is degraded. Real time protocols have been developed to improve voice transmission packet timing and arrival. They are not yet perfect, but are evolving rapidly. Thus, the quality and reliability of IP telephony calls vis-à-vis PSTN calls will not likely be a very long term issue. 43 A PBX, or private business exchange, is like a small telephone company central office that the user, rather than the telephone company, owns. 44 A reason this can be a fast growing area of IP telephony is that business networks are generally of a size small enough to be closely administered to assure adequate voice transmission quality and reliability. (See Footnote 3 above.) 45 For example, a customer located in Los Angeles can be given an area code normally associated with New York. This unorthodox numbering allocation process is apparently being followed because it has appeal for some potential customers, but it is a significant departure from the way telephone numbers are allocated over the PSTN. If its use continues and grows, it will cause the long accepted conventional process for allocating numbers and allow number exhaust estimates to be made for the PSTN to be adversely impacted.46 Since CLECs depend on SBC's network to provide service to their customers in California, it is important for SBC to provide OSS services to its CLEC customers in the same time and manner as it provides to its own customers. OSS services include pre-ordering inquiries, service ordering, service provisioning and installation, maintenance and repair, billing and other critical network services. The CLECs must receive these services "on par" with SBC to be competitive with SBC.
47 The twelve passed checklist items are (1) Interconnection; (2) Nondiscriminatory Access to Unbundled Network Elements, (3) Nondiscriminatory access to poles, ducts, conduits and rights of way; (4) Unbundled Loops, (5) Local Transport, (6) Unbundled Switching, (7) Access to 911, E911, Directory Assistance and Operator Call Completion Services, (8) White Page; (9) Access to Telephone Numbers; (10) Access to Databases; and (12) Dialing Parity; and (13) Reciprocal Compensation. The two failed items were (11) Number Portability and (14) Resale. 48 (FCC 01-361a1 1st Triennial Review, memo p22.) 49 Section 251(b)(2) of the 1934 Communications Act as added by the 1996 Telecommunications Act, and First Report and Order and Further Notice of Proposed Rulemaking, 11 FCC Rcd 8352, Paragraph 165. 50 Assuming that these customers would not switch carriers if they had to change their telephone numbers. 51 First Report and Order in the Matter of Telephone Number Portability, CC Docket No. 95-116, FCC 96-286, Paragraph 4. Memorandum Opinion and Order, CC Docket No. 95-116, FCC 02-215, Paragraph 1. 52 Billing complaints include disputes over: bill accuracy, billing after requested disconnect, late payments, early termination fees, cramming, abusive marketing, transferred bills or disputes over responsible party or individual liability for joint service, deposits, estimated billing, back-billing, and disputes over payment arrangements. Do not include rates. 53 Installation complaints include: delayed orders, missed appointments, service not completed by the due date, no facilities, manpower shortage, appointment not met, and inside-wiring repair charges. 54 Non-Regulatory complaints include equipment, interstate/international matters, cellular rates, internet providers, municipal utilities, payphone service, yellow or bold white page directories, labor charges, acts of utility employees and damages, low income programs, abusive marketing, and anything not in the tariff. 55 Rates Rules complaints include: rate design, authorized tariff rates or schedules, CPUC general orders, utility tariffs or contracts, Automatic Dialing And Answering Device (ADADS), as well as surcharges, fees, and taxes. 56 Service complaints include: disconnections, outages, service outages of any kind, no dial tone, any threat or actual termination of service by utility, quality of service, line trouble, static, crossed lines, intermittent service, voltage problems such as power surges, number/area code issues, utility safety, and issues with poles and/or lines. 57 Miscellaneous complaints are used when no other category exists, e.g., annoyance calls. 58 The issue is also discussed in Section 4.3 "State of UNE-P Competition: A Contentious Issued Under Review" and Section 4.10.4 "Legal Activities".