5 Results & Recommendations
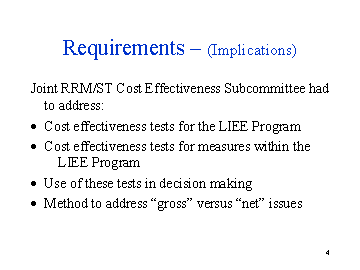
This section addresses (1) cost effectiveness tests results for the LIEE Program, (2) cost effectiveness tests results for measures within the LIEE Program, (3) use of these tests in making decisions, and (4) "gross" versus "net" issues, as required by OP 9. These discussions are followed by recommendations that evolved from the methods and approaches presented.
After considerable discussion, the Subcommittee decided that all cost effectiveness tests should be performed using program year (PY) 2000 data. This decision means that a full year of data is available as input to the calculations, while allowing the Task Group to meet the required deadline for this report.8 Consequently, no Rapid Deployment measures (SBX 5) are included in this analysis of the program or measures.
It should be noted that these results were obtained using utility estimates of costs and benefits from previous filings, and are presented only to illustrate the application of NEBs to the assessment of the Program. The utilities are currently conducting an impact evaluation of the LIEE Program, and this evaluation will generate new estimates of savings. These new estimates of savings will be used in subsequent program and measure assessments. For instance, the assessment of LIEE measures to be conducted by the LIEE Standardization Team to support PY 2003 planning will be based on new estimates of savings and updates of costs. Thus, the results shown in this section and in the associated appendices will not be used to determine measure selection for the PY2003 Program.
5.1 Cost Effectiveness Results of the LIEE Program
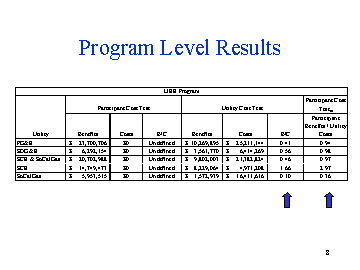
Using the inputs as specified in Section 3.1, the program level results of each cost effectiveness test are shown in Exhibit 4.1. In order to compare cost effectiveness across the state, it is useful to compare the total service by service area. Thus, for comparison purposes, utility level analysis was performed with the SoCalGas and SCE programs as a combined entity, since they serve roughly the same customers. For completeness, SoCalGas and SCE individual results are also presented.
Exhibit 4.1
Cost Effectiveness Test Results for the LIEE Program

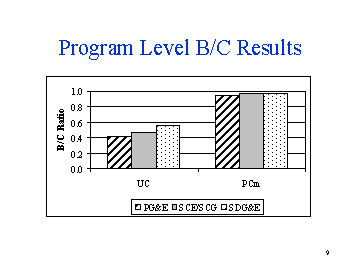
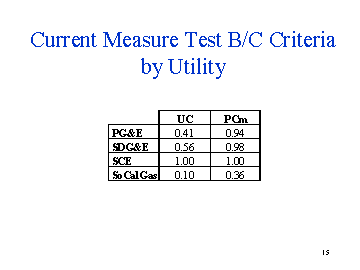
The results presented in Exhibit 4.1 show that, when comparing the total service by service area at the program level, each test shows similar results for all utility service areas. The UC test B/C included ranges from 0.41 to 0.56 and the PCm test B/C ratio varies from 0.94 to 0.98. Appendix B presents the UC and PCm test results both with and without NEBs, for completeness.
5.2 Cost Effectiveness Results of LIEE Program Measures
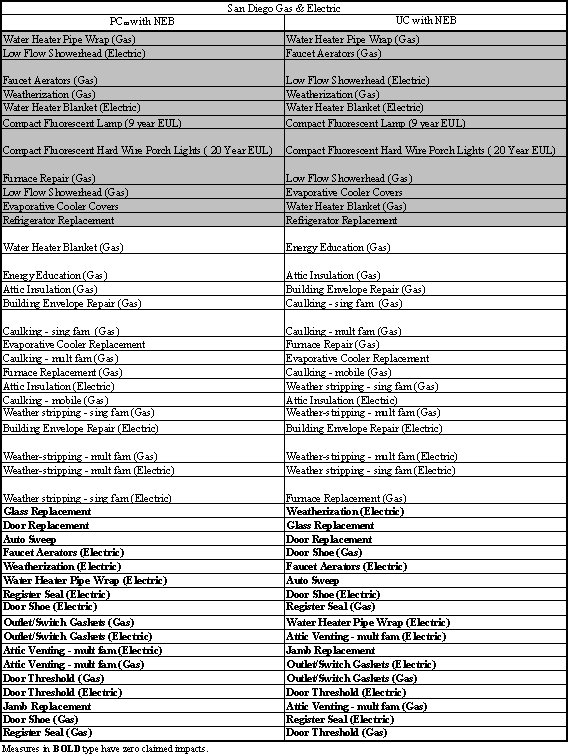
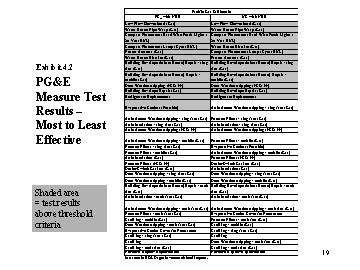
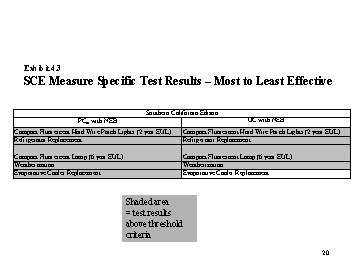
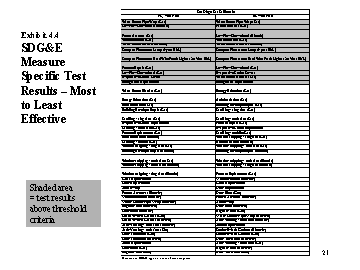
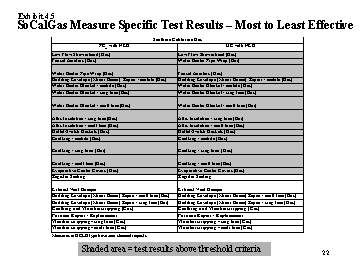
For the same LIEE measure, the measure level cost effectiveness results can vary across utilities if there are differences in either the incremental measure costs or the energy savings resulting from impact evaluations. Exhibit 4.2 through Exhibit 4.5, presented below, provide a simple top-to-bottom ranking for the measures, by B/C test result, for each individual utility. Shaded cells signify a B/C ratio equal to or greater than individual utility pass/fail criteria for that test. The individual criteria for UC and PCm test are shown in the two right hand columns of Exhibit 4.1 above (Note: for this purpose the combined SCE & SoCalGas values are not used). The ranking is based on the cost effectiveness test including the NEBs. All test values, by utility and test type, with and without the NEBs, are documented in Appendix C. Again, it should be noted that the rankings reflected in the tables below and in Appendix C may differ from those conducted in the course of the LIEE Standardization Team's assessment of current and potential Program measures.
Exhibit 4.2
PG&E Measure Test Results - Most to Least Effective
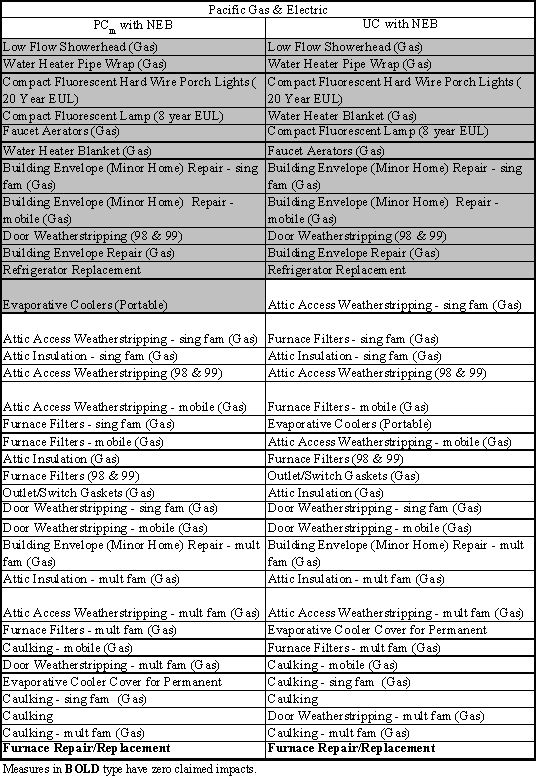
PG&E results indicate that about a third of the measures have PCm test results greater than 0.94 and a similar number have UC test results above 0.41.
Exhibit 4.3
SCE Measure Specific Test Results - Most to Least Effective

As the shading indicates, and as expected based on the overall program cost effectiveness tests for SCE (Exhibit 4.1), four of the five measures offered provide more benefit to the utility than they cost. The one measure that costs the utility more than the utility benefits, however, does provide participant benefits greater than utility costs.
Exhibit 4.4
SDG&E Measure Specific Test Results - Most to Least Effective
![]()
San Diego Gas & Electric has measures with no savings claimed because there were no studies supporting impacts for some measures or commodities. These measures have a cost, but no energy impacts or NEBs allocated to them. Therefore the B/C ratio is zero.
Exhibit 4.5
SoCalGas Measure Specific Test Results - Most to Least Effective
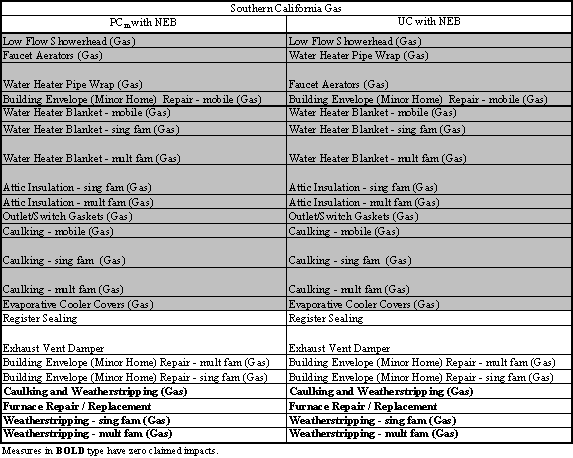
There are over half of measures that pass the low threshold of the SoCalGas program. Similar to SDG&E, there are a few measures with zero claimed impacts and zero B/C ratios.
5.3 Decision Making with Cost Effectiveness Tests
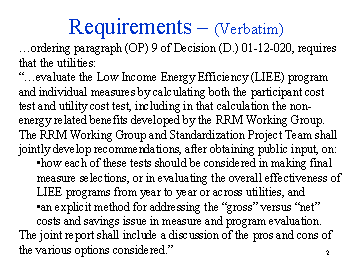
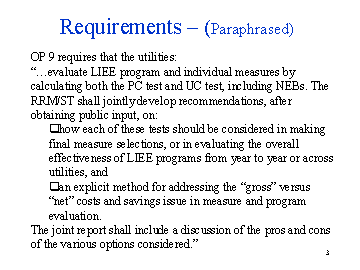
Ordering Paragraph 9 of D. 01-12-020, requires that the utilities:
"...The RRM Working Group and Standardization Project Team shall jointly develop recommendations, after obtaining public input, on:
· how each of these tests should be considered in making final measure selections, or in evaluating the overall effectiveness of LIEE programs from year to year or across utilities, ....
The joint report shall include a discussion of the pros and cons of the various options considered."
5.3.1 Decision Making for the LIEE Program
The Joint RRM/ST Cost Effectiveness Subcommittee believes that the decision has been made at the legislative level that the LIEE program is a social equity program that is not necessarily required to be cost effective (i.e., costs being less than benefits). As such, decisions about the continuation of the LIEE program as a whole are made on a policy basis rather than a cost-effective basis.
However, OP 9 of D. 01-12-020 mandated the Joint RRM/ST Cost Effectiveness Subcommittee to determine how program level cost effectiveness tests should be compared across utilities for a single year or within a single utility for multiple years. This is discussed next.
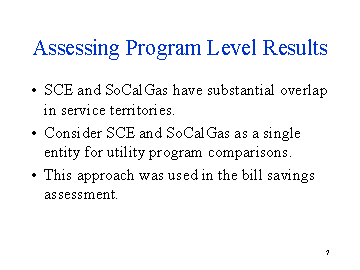
Comparison between utilities - While there are four utilities that provide the LIEE program, there are, effectively, only three service areas. The customer base of SCE and SoCalGas overlap greatly. Overlapping customers are provided LIEE services from both utilities within this overlap area. Therefore, it is recommended that the benefits and costs for SCE and SoCalGas be considered together for determining a single value for the PCm or UC.
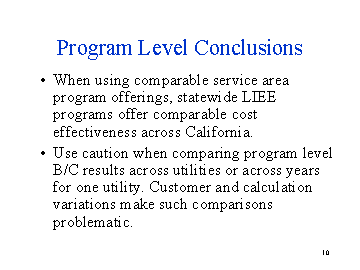
While it is useful to understand why different utilities have different cost effectiveness results, the Joint RRM/ST Cost Effectiveness Subcommittee feels that caution should be used when comparing these differences or attempting to make judgments about variation in values between utilities. As discussed at some length in the Bill Savings Standardization Report (which calculates a PCm for three full years), variations between the utilities are due to differences in the installed measure mix, the customer mix, and gas versus electric savings. As the standardization of the program continues and is applied consistently, some, but not all, of the variability based on measure mixes will diminish. Moreover, the effects of the other factors mentioned above will continue to cause variations across utilities for any given year. For example, compact fluorescent bulbs provide high electric savings. If a utility has a large number of this measure installed compared to another utility, then the overall program cost effectiveness ratio may be different due to the installed measure mix. While it is useful to compare between utilities for a single year, these points need to be kept in mind.
Comparison across years - Year-to-year comparisons of results for a single utility may be both useful and instructive. Using the fact that LIEE programs are not necessarily required to be cost effective, a case can be made for striving to improve the program from year-to-year to become as cost efficient as possible. Policy or legislative decisions will always be made to keep certain measures. While these measures may be expensive, additional measures could be added to offset that expense. An assessment of the differences from one year to the next would be required to understand why the B/C ratio changes. The forecasting of energy rates and avoided costs play a large role in determining benefits. Therefore, one could not compare between years if the forecasts are different. It should also be considered that comparison of past programs may not provide much useful information. The on-going standardization of this program, though, may lend itself to future comparisons.
5.3.2 Decision Making for Measures
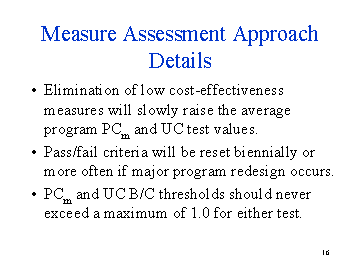
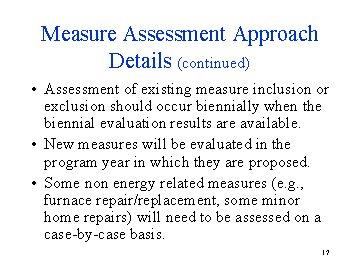
The Joint RRM/ST Cost Effectiveness Subcommittee believes that, especially in the LIEE arena, clear-cut rules on inclusion and exclusion of measures cannot be made based solely on measure cost effectiveness test numbers. Policy considerations are often a primary guiding element in decisions to retain measures within low-income programs.
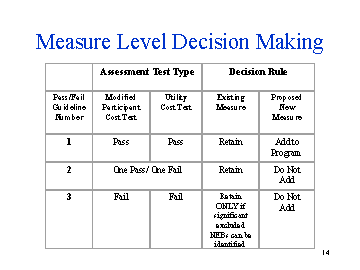
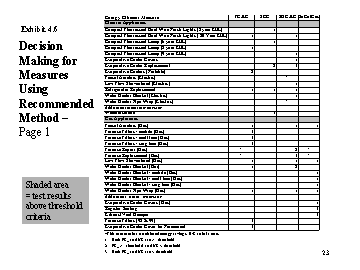
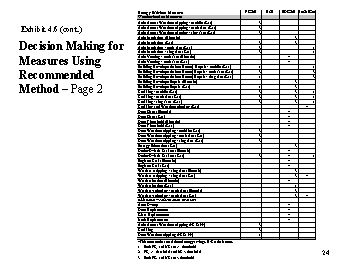
Using the approach described in Section 3.2.2 results in the values presented in Exhibit 4.6, identifying which measures met which criteria, by utility. The number in the exhibit matches the guideline value indicated Exhibit 3.4. In most cases, if the measure met criteria #2, it is the UC test that fails to meet the criteria.
Exhibit 4.6
Decision Making for Measures Using Recommended Method
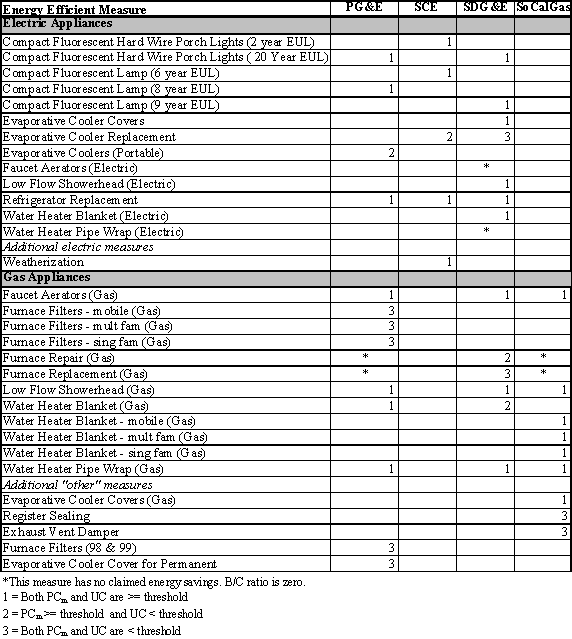
Exhibit 4.6 - continued
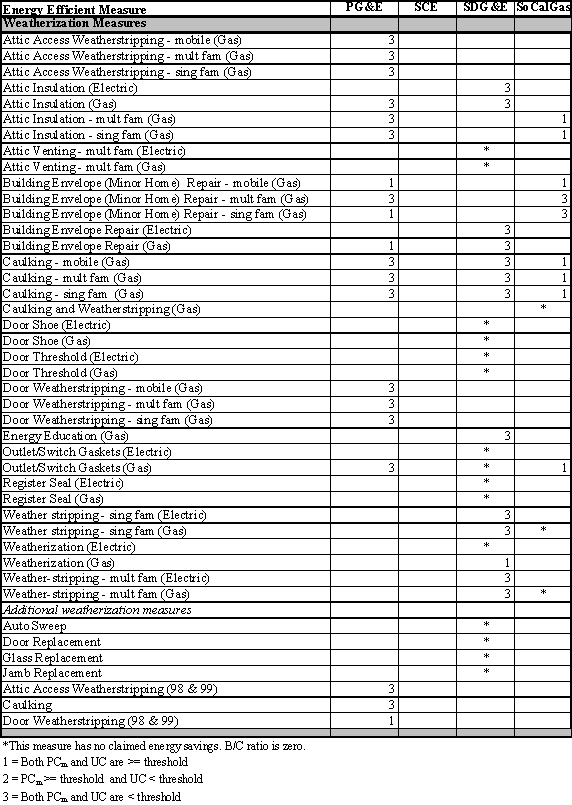
Using these guidelines, a very broad look at the electric appliances, gas appliances, and weatherization measures shows that electric appliances often have both a PCm and UC that are over the utility-specific thresholds. The electric appliances falling into category #1 are measures that are relatively easy to install and have the potential for high savings. For gas appliances, there are slightly more measures that have neither cost effectiveness tests over the thresholds. This is in line with the fact that gas measures tend to have lower impacts. The weatherization measures are manpower-intensive measures to install, yet provide relatively small impacts. As such, there is a high percent of measures that fail both cost-effectiveness tests. Interestingly, for weatherization measures, there are no measures which pass one test while failing the other.
5.4 "Gross" versus "Net" Issues
Ordering Paragraph 9 of Decision (D.) 01-12-020, requires that the utilities:
"...The RRM Working Group and Standardization Project Team shall jointly develop recommendations, after obtaining public input, on:
....
· an explicit method for addressing the "gross" versus "net" costs and savings issue in measure and program evaluation.
The joint report shall include a discussion of the pros and cons of the various options considered."
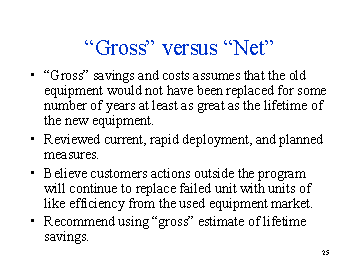
The gross versus net costs and savings9 issue being discussed here should be clarified. As stated in the discussion in the decision, "...using "gross" savings and costs assumes that the old equipment would not have been replaced for some number of years at least as great as the lifetime of the new equipment. The "incremental" approach assumes that the measures would have been replaced with standard efficiency new units in the absence of the installation of high efficiency units."
It is important, and useful to the discussion, to point out that currently this is only a practical issue for the high efficiency refrigerator measures. This is the only measure (other than some Rapid Deployment measures) where the utilities claim savings that have the logical potential for incremental costs and savings. Weatherization measures (such as caulking and weather stripping) are considered to have no "standard efficiency" level. They are either installed or not - therefore all weatherization measures are "gross" costs and savings. The same argument is made for the remainder of the electric appliances and gas appliance measures. This issue is not applicable to gas furnace replacement since the units are only replaced if broken. It is assumed that the customer would (or could) not replace the current unit at all, but would find a different way to heat their premises. Therefore, there is no "standard efficiency" level that would apply when determining costs or savings.
For the refrigerator measure it is the position of the Joint RRM/ST Cost Effectiveness Subcommittee that the most likely replacement for a broken refrigerator for the LIEE customer is a used refrigerator of comparable vintage or efficiency. It is considered highly unlikely that LIEE customers would buy a new standard efficiency refrigerator upon failure.
Additionally, the Joint RRM/ST Cost Effectiveness Subcommittee reviewed the current list of rapid deployment measures fielded during 2001, and concluded that the use of the "gross" costs and savings would seem to apply to them as well. It will be important to revisit this issue for all new measures brought into the LIEE program, as they are incorporated, to be sure that the logic of using "gross" costs and savings still applies.
Thus, the Joint RRM/ST Cost Effectiveness Subcommittee recommends use of the "gross" cost and savings for all measures in the LIEE program.
5.5 Recommendations
The Joint RRM/ST Cost Effectiveness Subcommittee makes the following recommendations:
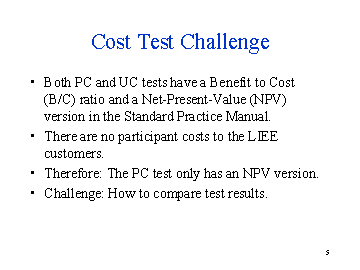
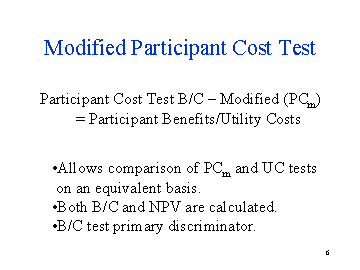
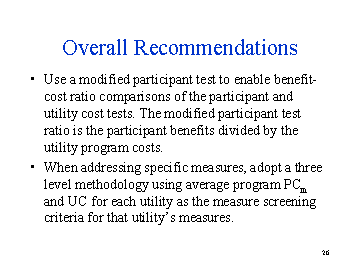
· Use a modified participant test to enable benefit-cost ratio comparisons of the participant and utility cost tests. The modified participant test ratio is the participant benefits divided by the utility program costs.
· When addressing specific measures, adopt a three level methodology using average program PCm and UC for each utility as the measure screening criteria for that utility's measures.
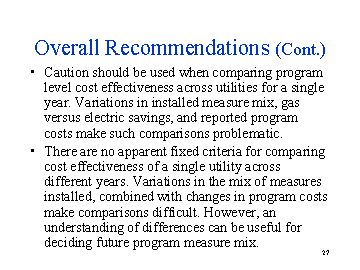
· Caution should be used when comparing program level cost effectiveness across utilities for a single year. Variations in installed measure mix, gas versus electric savings, and reported program costs make such comparisons problematic.
· There are no apparent fixed criteria for comparing cost effectiveness of a single utility across different years. Variations in the mix of measures installed, combined with changes in program costs make comparisons difficult. However, an understanding of differences can be useful for deciding future program measure mix.
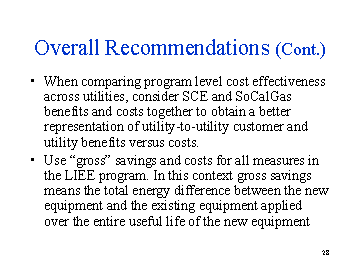
· When comparing program level cost effectiveness across utilities, consider SCE and SoCalGas benefits and costs together to obtain a better representation of utility-to-utility customer and utility benefits versus costs.
· Use "gross" savings and costs for all measures in the LIEE program. (Note: In this context gross savings means the total kWh difference between the new equipment and the existing equipment applied over the entire useful life of the new equipment.) The Joint RRM/ST Cost Effectiveness Subcommittee reviewed the PY2001 rapid deployment measures and concluded that the use of the "gross" costs and savings should be applied to them as well.
Appendix A
Non-energy Benefits Used in Calculations
Utility Non-Energy Benefits
Utility Benefit Category |
NEB Description |
Measures with this NEB |
Comments on NEB |
Reduced Carrying Cost on Arrearages (7A) |
Measured as the utility's interest savings from reduced arrearages carried. This is measured from the utility cost point of view. |
All measures except attic venting |
|
Lower Bad Debt Written Off (7B) |
Measured as the reduction in total bad debt written off for participants in the program. These represent a direct savings to the utility because extra revenues are received that would not otherwise have been received. |
All measures except attic venting |
The theory behind this NEB is strong, but the studies may be a bit weak. Recommended for further study in the future. |
Fewer shutoffs (7C) |
Reduced shutoffs are measured in terms of the net marginal cost to the utility from not having to send staff out to disconnect the account. |
All measures except attic venting |
The studies may be a bit weak. Recommended for further study in the future. |
Fewer reconnects (7D) |
Reduced reconnects from the program are measured only in terms of the net marginal cost to the utility from the reconnect - and is net of any reconnect fees paid by customers for the service. |
All measures except attic venting |
The studies may be a bit weak. Recommended for further study in the future. |
Fewer notices (7E) |
The improved payment behavior by customers leads to a reduction in utility costs for calls, notices, and other collection activities. This category measures only the reduced marginal cost to the utility because it can send fewer notices for poor payment behavior. |
All measures except attic venting |
|
Fewer customer calls (7F) |
Improved payment behavior by participants allows the utility to make and respond to fewer customer calls related to bill payment behavior. This is valued at the utility's marginal cost of fielding calls. |
All measures except attic venting |
|
Reduction in gas emergency calls (7H) |
On-site activities undertaken by the program pro-actively address some safety issues that could lead to expensive gas emergency calls. These benefits are valued at the marginal staff and travel cost of addressing fewer gas emergency calls. The value for this NEB is affected by the degree of safety efforts included in the utility's program. |
Furnace repair and furnace replacement only |
Based on one study. Recommended for further study in the future. |
Reduced Subsidy (7K) valued at utility and ratepayer savings |
The California utilities provide a 15% rate subsidy to qualified low-income customers. This subsidy is paid by other ratepayers and the cost is incorporated into the utility's revenue requirements. Lower energy use by participants leads to lower subsidies paid, increasing public benefits. This is valued at 15% of the bill savings for eligible participants. |
All measures except attic venting |
Participant Benefit Category |
NEB Description |
Measures with this NEB |
Comments on this NEB |
Participant water and wastewater bill savings (9A) |
Lower water and wastewater use provides direct participant bill savings from those utilities. |
Faucet aerator, low-flow showerhead, and energy education |
|
Participant value from fewer shutoffs (9B) |
Lower bills help reduce bill payment problems, reducing shutoffs. This reduces the time customers need to spend trying to get power restored. To be conservative, additional benefits that customers realize from the reduced service they receive from their homes when power is terminated was not included. |
All measures except attic venting |
Based on a few studies. Recommended for further study in the future. |
Participant value from fewer calls to the utility valued as time savings (9C) |
Lower energy use reduces bill payment problems and reduces the amount of time participants spend on the phone dealing with bill payment issues with the utility. This was computed as the saved hours that the participant no longer needs to spend on the phone, valued at minimum wage. The utility savings from these avoided calls were included separately. |
All measures |
Background study results have a wide range. Recommended for further study in the future. |
Fewer reconnects (9D) valued in saved time and costs for participants |
Lower energy use reduces bill payment problems for participants, reducing the hassles of both terminations (above) and reconnects. This NEB was valued as the reduction in reconnect fees that customers must pay to have service restarted. Recall that the utility valuation of reconnects was computed net of these customer payments, so double-counting this source of benefits has been avoided. |
All measures except attic venting |
Background study results have a wide range. Recommended for further study in the future. |
Property value benefits from program-provided home repairs (9E) |
When repairs are made to the property (broken panes replaced, porch repair, etc.) the value of the property increases for the participants. That is, if they were to sell the property, the price would increase, and the best estimate of that increase in value is the cost of the repairs. These costs were amortized over the period of the benefit cost evaluation. The benefit valuation from this source specifically excludes any energy savings contributions of these repairs to avoid double-counting with the energy benefits portions of the computations. |
All measures except energy education |
|
Fewer fire losses to participants and society (9F) |
Health and safety equipment and checks conducted through the program help reduce the risk of fires. This results in benefits to participants in terms of reduced property losses and mortality. These benefits (which can be viewed as accruing to the participants or to society) were valued at reduced losses and the lifetime earnings losses from lives that were estimated saved from the program. |
Furnace repair, furnace replacement, and furnace filters |
Recommended for further study in the future on the property value assumption in this NEB. |
Fewer health-related expenses from health and safety improvements (9G) |
When health and safety measures (e.g., carbon monoxide monitors) are included in the programs, their benefits are not energy savings, but rather health and safety benefits accruing directly to the residents in terms of lower hospitalization costs and health-related expenses. These benefits can be estimated either as the amortized cost of installation of the devices or as the avoided illnesses and mortality prevented because of the presence of the H&S equipment. However, the computed value of the benefit is zero because no health and safety measures were included in the default LIEE program design |
No measures |
|
Participant savings from fewer moves (9H) |
Evidence indicates that utility bills and shutoffs are the cause of some customer move-outs. Avoiding moves through lower energy use allows residents to avoid a variety of direct and indirect costs associated with moves. To be conservative, only a portion of direct costs of moves incurred by residents (search time valued at minimum wage) was included. Indirect benefits were omitted from the estimation. |
All measures except attic venting |
Background studies may be weak. Recommended for further study in the future. |
Fewer lost sick days from work (9I) |
Homes that are "tighter" and less drafty and have fully functional heating systems can result in fewer sick days for residents. This includes both direct costs for sick days lost from work (which was valued at minimum wage), and indirect costs from lower educational achievement from children losing days from school (not included in this computation). |
All weatherization measures except energy education |
|
Improved comfort, noise, and similar benefits to participants (9K1) |
The most commonly reported non-energy benefit noted and recognized by participants is additional comfort in the home. Similar extra benefits provided by weatherization programs include lower noise from added insulation, additional features on replacement equipment, and similar benefits. A proxy for these benefits, net of negative aspects of the program, was included in the computations. |
All weatherization measures except energy education and attic venting. Also, furnace repair, replacement, and filters - evap cooler replacement, covers, and maintenance - window AC |
|
Reduced other hardship benefits - control over bill and energy use (9K2) |
A key benefit associated with low-income weatherization programs is reduction in hardship. Some of these benefits are reflected in other categories, including reduced calls, shutoffs, reconnects, moves, and other categories included above. Additional hardship benefits accrue from participants gaining greater control over their bill, and reduced worries and concerns from this source. A multiplier derived from a willingness to pay (WTP) survey of California participants was used to estimate the extra benefits from this remaining portion of the hardship benefits. |
All measures |
Appendix B
Appendix C
Program Level Results with and without NEBs

Appendix D
Appendix E
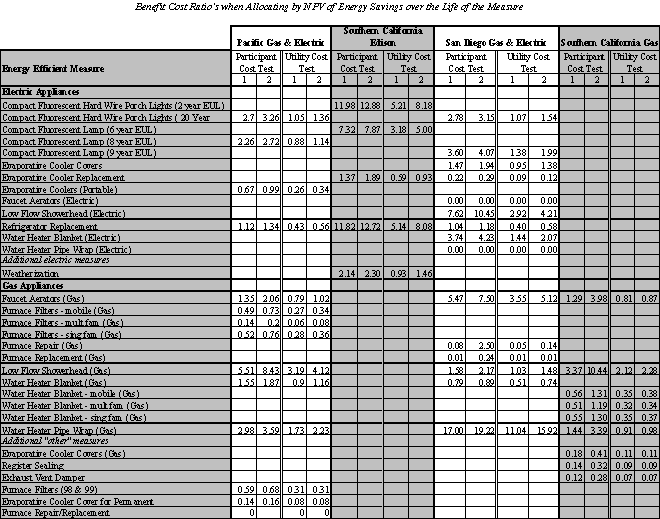
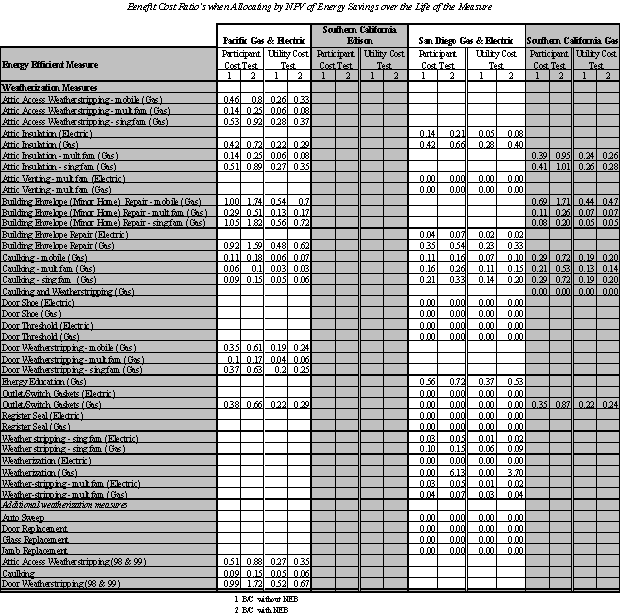
Results of Measure Specific Cost Effectiveness Tests
Appendix F
Results of Different Allocation Method
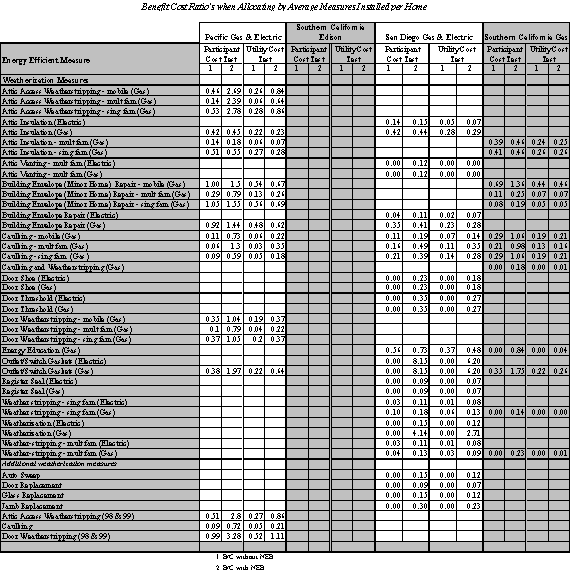
The data shown herein is the same table as in Appendix C except the allocation variable is the average number of measures installed per home. This appendix is provided for comparison purposes only, so an interested part can see the different B/C ratios determined by the two 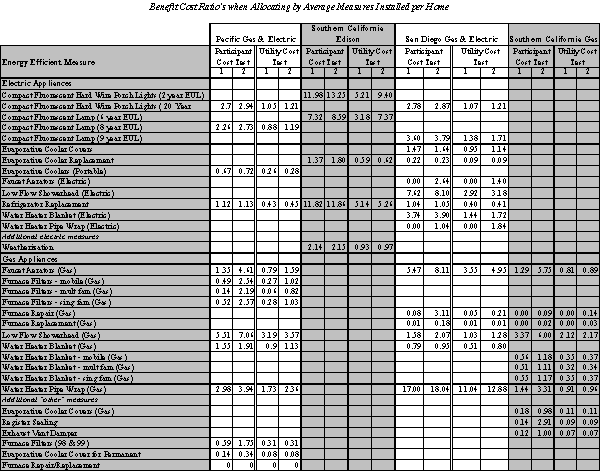 allocation methods.
Appendix G
Participants of Public Workshop
Summary of Public Workshops on LIEE Cost Effectiveness Draft Report
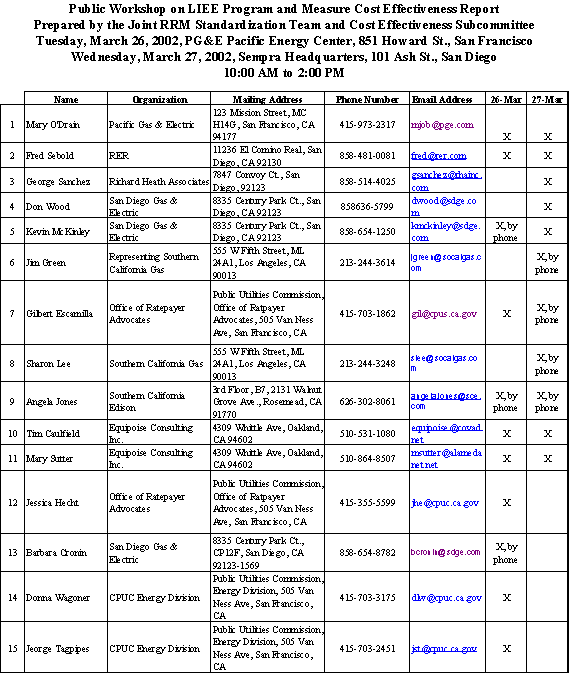
Two Public Workshops were noticed per California Public Utilities Commission (CPUC) requirements and held on March 26, 2002 in San Francisco and March 27, 2002 in San Diego. Equipoise Consulting facilitated and recorded the events at the meetings. Attendance lists are appended in Attachment A.
At the March 26th workshop in San Francisco utility and regulatory representatives attended but no members of any outside groups chose to attend. The meeting was called to order at 10:00 AM and was adjourned at 10:22 AM by unanimous agreement.
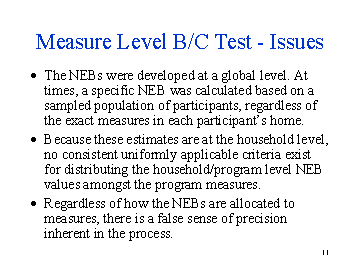
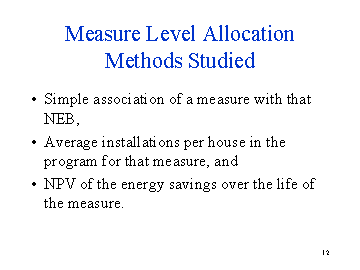
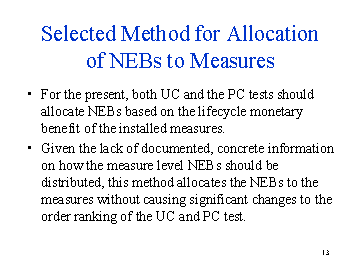
In San Diego on March 27th, one company outside the utility and regulatory members involved in development of the report was represented. The meeting was called to order at 10:00 AM. A presentation summarizing the results of the Draft Final Report for LIEE Program and Measure Cost Effectiveness (Attachment B) was reviewed and discussed.
The following issues were raised and responded to at the San Diego Workshop:
1. How do non-energy benefits (NEBs) continue to get evaluated and updated?
- If the subcommittee hears of new research, we will attempt to incorporate it, but currently there are no plans to update the NEBs
2. What is the next step for this work?
- Assuming that the ALJ accepts this method, it will be applied on measures for the July filing.
3. Are job creation NEBs incorporated into the current NEBs?
- While the subcommittee agrees that there are potential NEBs in this area, it was dropped due to possible double counting and very poor data quality. We felt that we could not substantiate a value for it.
4. Energy Education has many synergies. Are they captured by the current NEBs?
- There are some energy savings associated with this that are captured in bill savings. However, this is considered an integral service of the program, not a measure. We are not planning to evaluate energy education and do not expect that it will go away.
5. How do you separate interactions of individual measures versus the whole house?
- Because of known interactions, there are certain measures that potentially may be bundled for assessment purposes and to determine a retain/drop of the measures.
6. How should we apply NEBs to measures not in PY2000?
- The subcommittee agreed that how to apply NEBs to new measures is a potential problem that the standardization team will address.
The San Diego workshop was adjourned at approximately 11:00 AM by unanimous agreement since all issues had been discussed
Attachment A
Attendees at Both Workshops
Attachment B
Summary Presentation of Cost Effectiveness Report for Workshop
Appendix H
Formulas for Cost Benefit Analyses
The following formula for the PC and UC cost effectiveness tests are from the California Standard Practice Manual: Economic Analysis of Demand-Side Programs and Projects dated October 2001. They are represented here for the convenience of interested readers.
The work performed in this report used algorithms from Chapter 2 (Participant Test) of the Standard Practice Manual for the PC test and from Chapter 5 (Program Administrator Cost Test) of the Standard Practice Manual for the UC test. They are shown below.
Participant Test
NPVp = Bp - Cp
BCRp = Bp / Cp
Where: NPVp = net present value to all participants
BCRp = benefit-cost ratio to participants
Bp = NPV of benefit to participants
Cp = NPV of costs to participants
The benefit (Bp) and cost (Cp) terms are further defined as:
![]()
![]()
where: BRt = bill reductions in year t
BIt = bill increases in year t
TCt = tax credits in year t
INCt = incentives paid to participant by sponsoring utility in year t
PCt = participant cost in year t
PACat = participant avoided costs in year t for avoided alternate fuel devices
ABat = avoided bill from alternate fuel in year t
The second summation in the Bp algorithm is only used for fuel substitution programs and was not used in this analysis. For the analysis in this report, TCt, INCt, PCt, and BIt were all set to zero.
Utility Cost Test
NPVpa = Bpa - Cpa
BCRpa = Bpa / Cpa
Where: NPVpa = net present value of program administrator (utility) costs
BCRpa = benefit-cost ratio of program administrator (utility) costs
Bpa = benefits of the program
Cpa = costs of the program
The benefit (Bpa) and cost (Cpa) terms are further defined as:
![]()
![]()
where: UACt = utility avoided supply costs in year t
UACat = utility avoided supply costs for the alternate fuel in year t
PRCt = program administrator program costs in year t
INCt = incentives paid to participant by sponsoring utility in year t
UICt = utility increased supply costs in year t
The second summation in the Bpa algorithm is only used for fuel substitution programs and was not used in this analysis. For the analysis in this report INCt and UICt were set to zero.
8 PY2001 data will not be available until March, 2002. This report was due to be filed April 10, 2002. 9 "Gross" and "net" savings should not be confused with gross impact, net-to-gross ratio, and net impact nomenclature used in energy efficiency program evaluations.

