2004 MARKET PRICE REFERENT (MPR)
STAFF REPORTMPR Methodology to Determine The
Long-Term Market Price of Electricity for Use in California's 2004 Renewables Portfolio Standard (RPS) Power Solicitations
Prepared by the Energy Division and the Division of Strategic Planning of the California Public Utilities Commission
pursuant to Public Utilities Code Section 399 and D.04-06-015Principal Authors Wade McCartney and Paul Douglas
Review and Oversight by Sean Gallagher, Judith Iklé,
Bruce Kaneshiro, and Dan AdlerIn collaboration with the Renewable Energy Program
of the California Energy Commission
February 4, 2005
DISCLAIMER -- Opinions, conclusions, and findings expressed in this report are those of the authors.
This report does not represent the official position of the Commission until adopted by rule or decision at a Commission meeting. Commission staff would like to thank CEC collaborative staff for their comments and input.
Calculation of Market Price Referents (MPR)
The purpose of this staff report is to describe the assumptions and inputs used to calculate the Market Price Referents (MPRs) required by D.04-06-0151. The resulting MPRs provide the Commission with an estimation of the long-term market price of electricity for baseload and peaking power products that will be used in evaluating bid products received during the 2004 Renewable Portfolio Standard (RPS) power solicitations.
In accordance with D.04-06-015, the following MPRs (2004 $) represent "the levelized price at which the proxy power plant revenues exactly equal the expected proxy power plant costs on a net-present value (NPV) basis."2 The MPRs shown in Table 1 include transformer losses and line losses and, thus, reflect prices for power delivered to specified zonal delivery points like NP15 or SP15. Based on the adopted MPR methodology, the 10-, 15-, and 20-year MPRs are:

Table 1: 2004 Market Price Referents (MPRs)
At Specified Zonal Delivery Points (e.g., NP15 or SP15)
(cents/kWh)Resource Type
10-Year
15-Year
20-Year
Baseload MPR
5.61
5.62
5.63
Peaking MPR
(5x8 peaking product
over 12-months)10.79
10.83
10.85
MPRs Were Calculated Using a Cash-Flow Simulation Methodology
The MPRs shown above were calculated using the Southern California Edison (SCE) MPR model, a cash-flow simulation methodology approved by the Commission in D.04-05-015.3 The SCE MPR model calculates what it would cost to own and operate a power plant over a 20-year period. The cost of electricity generated by such a power plant, at an assumed capacity factor and set of costs, is the proxy for the long-term market price of electricity.
The MPR model requires several types of input data, including natural gas prices, capital costs, operating costs, finance costs, taxes, and power delivery assumptions. Two identical versions of the SCE MPR model were utilized to calculate the MPRs, one to calculate baseload MPRs, and another to calculate peaking MPRs. While the baseload and peaking models are the same, the capital and performance inputs will differ significantly, however, the two models will utilize the same finance inputs, tax inputs, and power delivery inputs (aside from capacity factor).
The baseload MPRs reflect an in-service capital cost of $720/kW, while the peaking MPRs reflect an in-service capital cost of $556/kW. The natural gas forecasts used in the two models are the same, except for the fact that that peaking gas forecast, per D.04-06-0154 is set at 95.8% of annual baseload gas prices to reflect an average reduction in mid-summer gas prices, when peakers typically operate. The MPRs shown in Table 1 were calculated using a gas price forecast with years 1-5 consisting of NYMEX data and four Henry Hub fundamental forecasts for years 6 -20.
The primary input drivers for the MPR calculation are the California (CA) gas price forecast, power plant capital costs, and the capacity factor for the peaking MPRs.
MPR Gas Price Forecast
D.04-06-015 noted that there is no transparent, liquid market for natural gas forward products for 10, 15 or 20-year terms, which is necessary in order to fuel a proxy power plant producing fixed-priced electricity over these time periods. Consequently, D.04-06-015 outlined a California gas forecasting methodology for years 1 through 6, and another methodology for years 7 through 20, both of which are based on the forward Henry Hub (HHub) gas price that is basis adjusted to California.5
D.04-06-015 determined that NYMEX HHub futures price would be used for all or part of the first six years of the gas forecast6. For years 7-20, a fundamentals forecast approach would be used, incorporating the forecast escalation methodology advocated by certain parties7. This method entails calculating the average annual escalation rate among a number of different long-term Henry Hub forecasts, including timely forecasts produced by CERA, PIRA, Global Insight, EIA, and the CEC. This average annual escalation rate would then be used to escalate the last year of NYMEX data out to 2024. In addition, a gas hedging transaction cost would be added to both the NYMEX and fundamental gas prices8. Using this adopted methodology, parties worked collaboratively to develop the MPR gas model used to calculate the MPRs presented in this staff report9.
Based on this adopted methodology10, the levelized 20-year baseload and peaker gas prices11 are:
#
Table 2: MPR Gas Forecasts
Value
1
Baseload Gas Price ($/MMBtu) - levelized 20 year forecast
5.60
2
Peaker Gas Price ($/MMBtu) - levelized 20 year forecast
5.37
MPR Henry Hub Forecast Incorporates 5 years of NYMEX Futures -- Years 1 through 5
D.04-06-015 determined that NYMEX futures contracts are the best representations of forward market prices for natural gas; however, there was no consensus on using NYMEX prices for the entire period of years 1 through 6. CalWEA/CBEA, PG&E, and SCE would use NYMEX prices for the entire period of years 1 through 6. CEERT would only use NYMEX prices for the first two years. TURN and SDG&E would only use NYMEX prices for the first three years, unless significant trading volumes justify reliance on prices for years 4 through 6.
Neither CEERT, TURN, nor SDG&E set forth an acceptable volumetric threshold above which the use of NYMEX prices would be considered sufficiently liquid to be acceptable for years 3 through 6. Because these are in fact available transaction-based prices for natural gas forwards, and because no quantitative threshold or other basis was adequately presented to judge these transactions as insufficiently liquid, D.04-06-015 directed staff to study the NYMEX data in advance of the preparation of the MPRs and determine whether the full six years, or some subset thereof, is appropriate. Staff studied the NYMEX data and determined that five years should be used in calculating the MPR HHub forecast.
With regard to the actual calculation of the annual NYMEX forward price, D.04-06-015 stated that, "...for purposes of establishing the gas price forecast for years 1 through 6, we will use a NYMEX 60-trading day average."12 Staff has determined that the 60-day period should be the 60 days prior to the close of the last 2004 RPS solicitation (PG&E), which was August 23, 2004. This approach is consistent with the direction provided by D.04-06-015, which stated that staff should begin the process of calculating the MPRs once the RPS solicitations have closed.
MPR Henry Hub Forecast Incorporates 4 Henry Hub (HHub) Forecasts -- Years 6 through 20
CalWEA/CBEA and PG&E recommended that the Commission use natural gas fundamentals forecasts produced by CERA, PIRA, and Global Insight to forecast prices for years 7 through 2013. In addition, CalWEA/CBEA noted that the public sector forecasts produced by the CEC and the Energy Information Administration (EIA) could also be consulted. TURN recommended using an average of these private and public sector forecasts. D.04-06-015 directed staff to utilize multiple forecasts in calculating the escalation factor, and to evaluate each forecast in regard to its appropriateness for this task14 . Specifically, this is the forecast of escalation rates method advocated by CEERT, TURN, and SDG&E, as described above.
The MPR Henry Hub (MPR - HHub) forecast was developed using two private and two public 20-year Henry Hub fundamental forecasts15. Specifically, the two public forecasts were from the U.S. Energy Information Administration (EIA) and California Energy Commission (CEC) 16. With regard to the two private forecasts, one was from Southern California Gas (SoCal) and the other was a private sector natural gas forecasts from Cambridge Energy Research Associates (CERA), PIRA Energy Group, or Global Insight. Due to contractual obligations requiring the CPUC to keep the forecast confidential, staff can not reveal which of the three firms the forecast was purchased from.
It should be noted that the EIA HHub forecast is derived by manipulating the EIA's forecasted wellhead prices. Specifically, EIA examined the relationship between Henry Hub spot prices for natural gas and the U.S. wellhead price for the period spanning August 1996 through December 200017. Their analysis determined the extent to which the two price series are linearly correlated and also evaluated the statistical properties of two simple price relationships-the actual difference and the percent difference. The results of the analysis indicated that there was a strong linear relationship between the two price series, to the effect that, on average the Henry Hub spot prices were 32 cents per thousand cubic feet (10.8 percent) higher than wellhead prices. The median value of the actual difference is 24 cents per thousand cubic feet, and the median value of the percent difference is 10.4 percent. Consequently, staff escalated the EIA wellhead prices by 10.8% to derive a proxy HHub forecast.
California Basis Adjustment was Held Constant After 2007
CalWEA/CBEA, PG&E, SCE, TURN and SDG&E agreed that the NYMEX data should be basis adjusted (positive or negative) to California. D.04-06-015 adopted this recommendation18, stating that gas prices should be estimated at the proxy power plant burner tip, which would include a basis adjustment to the California border (e.g., the average of the SoCal border and the PG&E Citygate delivery points).
In the PG&E MPR gas model used by the CPUC, the California basis adjustment beyond the last year of NYMEX Clearport data was determined by calculating the average annual escalation rate among a number of different long-term PG&E Citygate and SoCal Topock basis forecasts. This average annual escalation rate was then used to escalate the last year of NYMEX Clearport data out to 2025. Because staff was unable to get access to a number of different long-term PG&E Citygate and SoCal Topock basis forecasts, staff held the last year of NYMEX Clearport data (2007) constant out to 2025, thus creating a proxy basis adjustment forecast.
MPR Capital Costs
Energy Division used the CEC Cost of Generation Report19 and associated spreadsheet models to estimate total in-service capital costs20 (2004$) for both a combined-cycle gas turbine (CCGT) power plant as the baseload resource, and a combustion turbine (CT) as the peaking resource.
Baseload Capital Costs
The majority of the parties in R.01-10-024 and R.04-04-026 proposed costs that ranged from $675/kW to $836/kW in 2004$. The CEC Cost of Generation Report estimated an in-service cost of $616/kW in 2004$; however, the CEC figure intentionally does not include interconnection costs, environmental permitting costs (aside from emissions), additional capital costs for dry cooling, and contingency costs.
Using the CEC's Cost of Generation model, Energy Division calculated a value of $720/kW for the CCGT baseload resource. This estimate was developed in consultation with CEC staff and includes $61 million in adjustments as shown here:
· Addition of dry cooling equipment capital costs in the amount of $20 million.
· Addition of $23 million of interconnection costs, including a $15 million substation, and an $8 million transmission line at $1 million per mile.
· Addition of a 5% project contingency which amounts to $16 million.
· Addition of $2 million for environmental review, mitigation, and permitting costs, and small amount of $5,000 for local permitting.
Energy Division's estimate of $720/kW is close to the SCE Benchmark Study21 figure, which was adjusted to include financing costs.22
Peaker Capital Costs
Parties in R.01-10-024 and R.04-04-026 proposed costs that ranged from $515/kW to $551/kW. The CEC Cost of Generation Report estimated an in-service cost of $485/kW in 2004$, however, the CEC figure did not intentionally include any interconnection costs, environmental permitting costs (aside from emissions), contingency costs, or additional AFUDC costs. PG&E recommended $516/kW, while CEERT recommended a range of $535/kW to $560 (an average of $548/kW), both estimates were based on the CEC Cost of Generation Report CT estimate.
Energy Division opted to use the CEC Cost of Generation Report model for the combustion turbine (CT) plant, and calculated a total in-service cost in 2004$ of $556/kW. This estimate was developed in consultation with CEC staff and includes just under $7 million in adjustments as shown here:
· Addition of $5 million of interconnection costs, including a $3 million substation, and a $2 million transmission line at $1 million per mile.
· Addition of a 2.5% project contingency which amounts to $1.3 million.
· Addition of $0.5 million in environmental review, mitigation, and permitting costs, and small amount of $5,000 for local permitting.
Finance, Tax, & Power Delivery Inputs
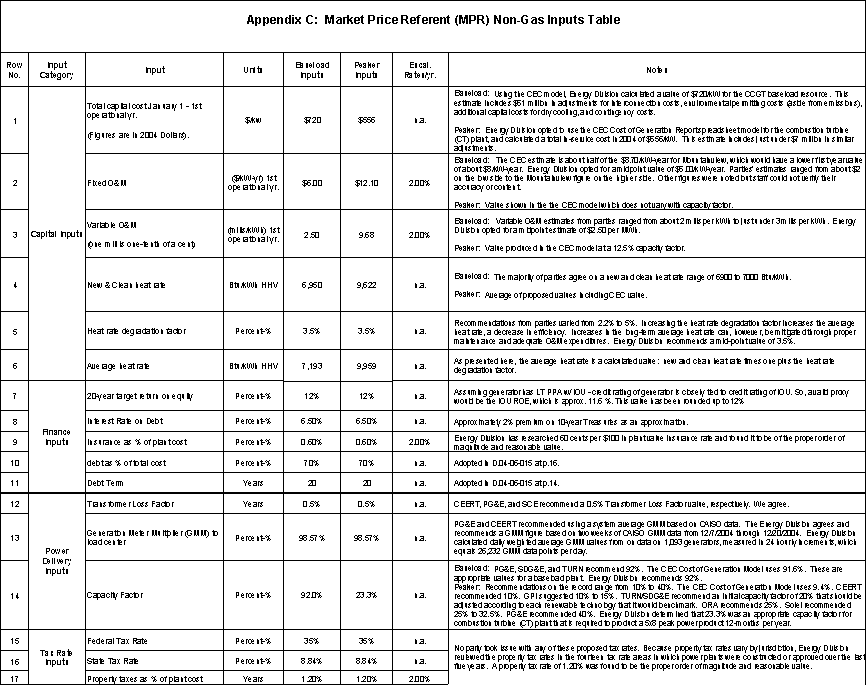
As noted earlier, the MPR model will utilize the same finance inputs, tax inputs, and power delivery inputs (aside from capacity factor) to calculate baseload and peaker MPRs. Those figures are shown in "Appendix C, Market Price Referent (MPR) Non-Gas Inputs Table" to this report.
Baseload Capacity Factor
PG&E, SDG&E, and TURN recommend a baseload capacity factor of 92%. Several other parties recommended using lower capacity factors that may be more representative of intermediate resources. The CEC Cost of Generation Report specified a 91.6% capacity factor for a baseload resource. Energy Division utilized a 92% capacity factor to calculate the baseload MPRs.
Peaker Capacity Factor
Capacity factor recommendations for the peaking resource ranged from roughly 10% to 40% in R.01-10-024 and R.04-04-026. However, Energy Division found that most parties did not provide an abundance of supporting evidence or rationale for their recommendations on peaker capacity factors.23 See Table 3 below for the various peaker capacity factors proposed by the parties.
#
Table 3: Proposed Peaker Capacity Factors
Value
1
CEC Cost of Generation Report
9.4%
2
CEERT
10%
3
GPI
10 to 15%
4
TURN/SDG&E
20%
5
ORA
25%
6
Solel
25% to 32.5%
7
PG&E
40%
All other things being equal, this extremely large range of peaking capacity factors could produce a correspondingly large range of peaking MPRs. Such a range of outcomes lead staff to more precisely define the specific type of peak power product that the peaking MPRs would represent.
To date, the Commission has not set forth a specific definition of peak power in conjunction with the MPR process. As part of their respective 2004 Renewable Power Solicitations, staff observed that both PG&E and SDG&E specified 5x8 peak power products (5 days per week, 8 hours per day). However, each utility specified different delivery windows for this power product:
· PG&E: "Peaking24 means power delivered on a "5x8"25 schedule during June thru September with a Capacity Factor of at least 95%."
· San Diego Guidelines for Peaking Resources26:
o July, August, September, October: Mon-Fri 11am-7pm (excluding NERC Holidays); and
o January - June and November - December: Mon-Fri 1pm-9pm (excluding NERC Holidays)27
Given that both utilities specified 5x8 peak power products, staff determined that it was necessary to reconcile the relationship between the 5x8 peak power products with the estimate of the long-term market price of electricity for peaking power as calculated in the MPR model, which simulates the ownership and operation of a combustion turbine (CT) power plant. Staff determined that the peaking capacity factor should follow from the peak product solicited.
Thus, for a 5x8 peaking product over 12 months, the maximum product hours would be 2,086 hours (365x5x8÷7), less six NERC holidays, the maximum output would equal 2,038 hours (2086-48). This equates to a 23.3% capacity factor (2,038÷8,760) over 12 months.
For a 5x8 peaking product over 4 months, the maximum product hours would be 697 hours (122x5x8÷7), less two NERC holidays, the maximum output would equal 681 hours (697-16). This equates to a 23.3% capacity factor (681÷2,928) over 4 months.
Some might be inclined to calculate an annual capacity factor for a 4-month 5x8 power product. The corresponding capacity factor over a 12-month period for this 4-month product would be 7.8% (681÷8,760). Use of this capacity factor would result in significantly higher peaking MPRs. However, for this price premium, PG&E would still only have use of the 5x8 contract for only 4 months out of the year. Thus, the utility would essentially be paying for an option on which it could not call, i.e., PG&E could not call on the 5x8 contract outside the June through September timeframe.
There is also the issue that peaking MPRs calculated at a 7.8% capacity factor would allow a generator to recover its entire capital costs over a 20-year period while only operating four months out of the year under an RPS contract, yet the same generator could also contract with another counterparty outside the June through September timeframe and, conceivably, enter into a contract with capacity payments. Thus, the utility and ratepayers would be unfairly over-paying for the capacity provided.
Therefore, given the above considerations, staff opted to use a peaking capacity factor of 23.3% (2,038÷8,760) over 12 months for use in calculating peaking MPRs.
If a utility is evaluating peaking bids that do not conform to the 12-month production profile (i.e., a 5x8 product delivered over four months), it should seek further guidance from Energy Division regarding the appropriate referent for use in that evaluation.
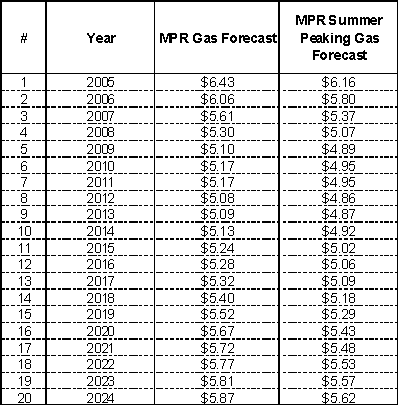
Appendix A: 20-Year California MPR Natural Gas Forecast
($/MMBtu)
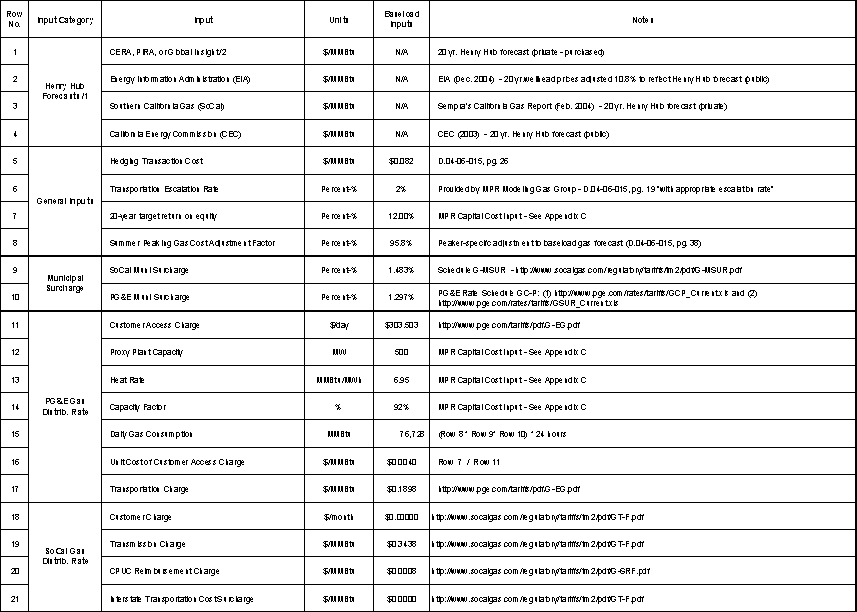
Appendix B: MPR Gas Forecast Inputs Table
1/ The Henry Hub forecasts are inputs for the MPR - Henry Hub forecast - there are no specific baseload values.
2/ Due to contractual obligations requiring the CPUC to keep the forecast confidential, staff can not reveal which of the three firms the forecast was purchased from.
1 D.04-06-015, p.31, footnote 21.
2 D.04-06-015, p.6.
3 The majority of the parties agreed that the SCE MPR model had one of the most transparent structures and required the fewest modifications, thus it was adopted by D.04-06-015 (pg. 12). A description of the SCE MPR model is contained in Appendix A to D.04-06-015.
4 D.04-06-015, p.39
5 "The Henry Hub is the largest centralized point for natural gas spot and futures trading in the United States. The New York Mercantile Exchange (NYMEX) uses the Henry Hub as the point of delivery for its natural gas futures contract." ( http://www.eia.doe.gov/oiaf/analysispaper/henryhub/ ).
6 D.04-06-015, pg. 21 & 38
7 D.04-06-015, pg. 21 - 24
8 D.04-06-015, pg. 26 -27 & 39
9 On July 23, 2004, Energy Division circulated a `straw' MPR gas forecasting model to the MPR Workshop Participants and to the R.04-04-026 Service List for review and comment. PG&E modified the gas forecast model on August 16, 2004 and circulated it to the R.04-04-026 service list, per Energy Division's request. No changes to the PG&E gas model were proposed by the parties.
10 See Appendix B for a detailed discussion of specific gas inputs
11 See Appendix A for a 20-year annual California MPR natural gas forecast.
12 D.04-06-015, pg.20
13 Private sector natural gas forecasts by Cambridge Energy Research Associates (CERA), PIRA Energy Group, and Global Insight (formerly DRI), respectively.
14 D.04-06-015, pg. 37
15 Fundamental forecast is developed by using a supply and demand model to determine the market clearing price of gas.
16 The natural gas forecasts employed in this process will include the most recent or otherwise most appropriate forecast prepared by the CEC. (See, Public Resources Code section 25302.)
17 U.S. Natural Gas Markets: Relationship Between Henry Hub Spot Prices - EIA Analysis ( http://www.eia.doe.gov/oiaf/analysispaper/henryhub/index.html)
18 D.04-06-015, p.19
19 The CEC's August 2003 Comparative Cost of California Central Station Electricity Generation Technologies report, www.energy.ca.gov/reports/2003-08-08_100-03-001.PDF, is the most recent version of this report. This report was prepared in support of the CEC's Integrated Energy Policy Report (IEPR) Subsidiary Volume: Electricity And Natural Gas Assessment Report, see p.10 for citation, www.energy.ca.gov/2003_energypolicy/index.html.
20 See Appendix C for a detailed discussion of capital costs.
21 Southern California Edison Co on behalf of Mountainview Power Co, LLC's seeking expedited FERC approval of the Power Purchase Agreement under ER04-316, December 19, 2003. Availability: Public. "SCE Benchmark Study" as used in this Energy Division memo primarily refers to Attachment F: Affidavit of Joseph B. Wharton for SCE. The purpose of the Wharton Affidavit was to show that the price paid by SCE for Mountainview was, in fact, competitive. The affidavit states that it complied with FERC's Edgar and Ocean State Power II standards (Affidavit at p.2).
22 PG&E, SCE, and CalWEA/CBEA relied in whole or in part on the SCE benchmark study. There respective estimates were $675/kW, $700/kW, and $740/kW. The CalWEA/CBEA figure represents the low end of its proposed range. CalWEA/CBEA actually cited TURN/SDG&E for the $740/kW figure who, in turn, noted that the $740/kW is an average from the SCE benchmark study. Interestingly, the actual average reported in the SCE Benchmark Study is $617/kW and represents the "average cost of eleven comparable plants in California" (Wharton Affidavit, p.2). The SCE Benchmark Study did not include financing costs or allowance for funds used during construction (AFUDC) (Id, p.6).
23 The CEC Cost of Generation Report did not, for example, provide specific supporting evidence for its 9.4% recommendation. However, CEC staff stated that a 10% capacity factor was generally agreed to during the CEC workshop process for general planning and discussion purposes.
24 PG&E RPS Solicitation Protocol, July 15, 2004, p.3.
25 PG&E 5x8: Hour ending (HE) 13-20 PPT, Monday through Friday, except NERC holidays.
http://www.pge.com/suppliers_purchasing/wholesale_electric_supplier_solicitation/renewables2004.html
26 Request For Offers, Eligible Renewable Resources,
July 1, 2004, p.3.
27 NERC Holidays: New Year's Day, Memorial Day, Independence Day, Labor Day, Thanksgiving Day, and Christmas Day.

