| Word Document |
CALIFORNIA PUBLIC UTILITIES COMMISSION
CALIFORNIA NATURAL GAS INFRASTRUCTURE OUTLOOK
2002 - 2006
November 2001
The Commission's Energy and Strategic Planning Divisions prepared this report. The principle authors are Richard Myers, Sepideh Khosrowjah and James Hendry.
AN OVERVIEW OF CALIFORNIA'S NATURAL GAS INFRASTRUCTURE 11
A. Regulatory History and Current Structure 22
B. California's Natural Gas Primarily Comes from Out of State 66
C. California Relies on Four Major Interstate Pipelines to Bring Gas to the California Border 77
D. Utility Gas Transmission and Distribution Systems Take Gas From Interstate Pipelines to Consumers 99
E. The PG&E, SoCalGas, and SDG&E In-State Gas Transmission Systems 1111
F. Non-Utility Deliveries from Bypass Pipelines and California Producers Supplied 17% of the Natural Gas Consumed in California 1515
G. California's Storage Improves System Reliability and Price Stability 1616
H. CPUC Has Identified Where Infrastructure Improvements Are Needed, and Projects Are Progressing 1818
LEARNING FROM THE EVENTS OF 2000 -- 2001 2525
A. A Combination of Unusual Events Led to Extremely High Natural Gas Prices and Supply Shortages in 2000-2001 2525
B. The Dramatic Increase in the California Border Price Was Not Caused By Inadequate Natural Gas Infrastructure in California 3030
C. Positive Outlook for Natural Gas System As we Go Into Winter 2001 - 2002 3131
STATE AND UTILITY FORECASTS FOR 2002 TO 2006 3232
A. California's Natural Gas Infrastructure Can Meet Forecast Demand Under Adverse Weather Conditions 3333
B. Demand from Gas-fired Electric Generating Plants Should Decline 3636
C. Conservation and Economic Uncertainty Affect Gas Demand 4040
D. Forecasts for 2002-2006 Indicate That California's Natural Gas Infrastructure Will Be Adequate During the Next Five Years Under Likely Weather and Hydroelectric Scenarios 4141
CONCLUSIONS AND RECOMMENDATIONS 5454
A. Conservation, Renewable Energy, and More Efficient Production of Electricity Will Reduce Demand On California's Natural Gas Infrastructure 5454
B. Improved Coordination Between Electric and Gas Operations Can Enhance Gas System Reliability 5656
C. The Power Authority Should not Fund New Gas Infrastructure Projects 5757
D. The CPUC Should Continue to Evaluate the Need For Gas Infrastructure Expansions 5858
EXECUTIVE SUMMARY
The California Public Utilities Commission (CPUC) regulates the rates and services of California's natural gas utilities, including backbone gas transmission systems, local gas transmission, storage, gas distribution, and gas procurement. To assist state policymakers in the evaluation of California's natural gas infrastructure system, and in conformance with the directives of Senate Bill 6 (Burton and Bowen) of the First Extraordinary Session, 2001, the CPUC has issued its 2002-2006 California Natural Gas Infrastructure Outlook report.
The report assesses California's natural gas transportation and storage system, and concludes that it is adequate to provide seasonally reliable amounts of competitively priced natural gas to residential, commercial, industrial, and electric generation customers. Therefore, the CPUC recommends that the Power Authority should not finance any new natural gas projects.
The report also reviews the events that led to high natural gas prices in California in 2000 and 2001, and the steps that are underway to ensure the reliability of the state's natural gas system for the coming years.
CHAPTER 1
AN OVERVIEW OF CALIFORNIA'S NATURAL GAS INFRASTRUCTURE
A. Regulatory History and Current Structure
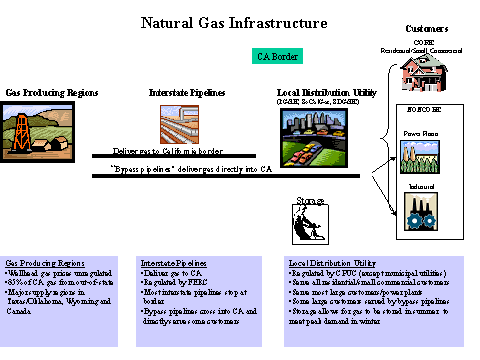
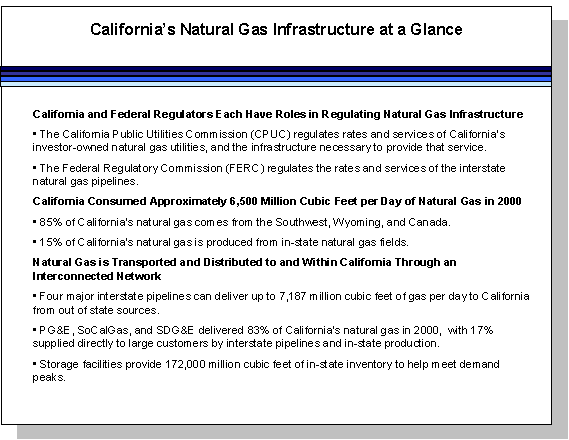
 The California Public Utilities Commission (CPUC) regulates the rates and services of the California gas utilities for their in-state gas transmission, distribution, storage, and procurement services.1 The Federal Energy Regulatory Commission (FERC) regulates prices, services, and the construction of the interstate pipelines that serve California.2
Historically, California's natural gas utilities were vertically integrated - they provided all gas services to their customers, including procurement, transportation, storage, distribution, metering, and billing. The two largest-vertically integrated gas utilities in California purchased most of their natural gas under long-term contracts with the interstate pipelines at federally regulated prices, and delivered the gas to wholesale3 and retail customers at rates established by the CPUC.
The regulation of natural gas utilities was transformed following the passage of the federal Natural Gas Policy Act (NGPA) in 1978. The NGPA, which Congress adopted in response to regional gas supply shortages, established a schedule for eliminating wellhead price controls to promote increased production of natural gas. By the early 1980s, supply shortfalls turned to surplus, and a natural gas spot market developed at the wellhead in the producing regions.
The availability of cheap natural gas supplies on the spot market led federal policymakers to adopt a series of regulatory initiatives to release utilities from high-priced, long-term purchase contracts with the interstate pipelines and to open up transportation service on the pipelines.
¬ Order 380, issued in 1984, modified the utilities' contract obligations to pay for high-priced gas from the interstate pipelines. This order enabled utilities to purchase lower-priced natural gas directly from wellhead suppliers.
¬ Order 436, issued in 1984, allowed utilities and large customers to transport their own natural gas on the interstate pipelines.
¬ Order 636, issued in 1992, established procedures for shippers4 with firm interstate pipeline capacity rights to market this capacity to others. The assignment of pipeline capacity under Order 636 is called "capacity brokering."
In tandem with the reforms at the federal level, the CPUC established a new regulatory framework for California's gas utilities to give the largest gas users access to the spot market and to allow them to make their own gas purchase arrangements. In 1988, the CPUC split gas utility customers into two main customer groups: core and noncore customers.
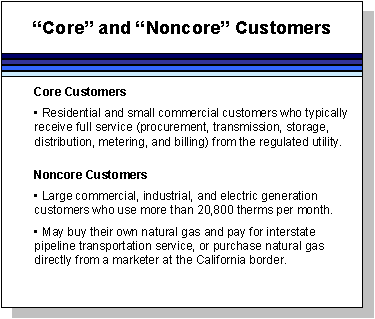 Core customers, primarily residential and small commercial consumers, continued to receive natural gas, transportation, storage, and related services from a vertically integrated and regulated utility. Noncore customers, including large commercial, industrial, and electric generation consumers, were given the option of making their own gas supply arrangements by buying gas directly from producers or from marketers5, and having the utility deliver the gas from the California border to the customer. Noncore customers no longer had to pay for the interstate capacity that the utility had originally obtained for all customers.6 In the early 1990's, the CPUC allowed core customers to purchase gas supplies from a marketer rather than the regulated gas utility.
In 1990, responding to a shortage of interstate pipeline capacity to California, the CPUC adopted a "let the market decide" policy for new interstate pipeline capacity proposals.7 Prior to this policy shift, large noncore gas customers had experienced significant curtailments8 and in response, numerous pipeline companies proposed expansions of interstate capacity to California.
Under its "let the market decide" policy, the CPUC supported those expansions that had the financial backing of market participants. The CPUC and the FERC shared the view that shippers, who wanted additional pipeline capacity into the state, had to be willing to pay for that capacity. The CPUC policy did not require California's existing utility customers to pay for any of the proposed expansions in their utility bills. Ultimately, new interstate pipelines bringing gas into California were built, several existing pipelines were expanded, and the utilities expanded their systems to take delivery of the new gas supplies.
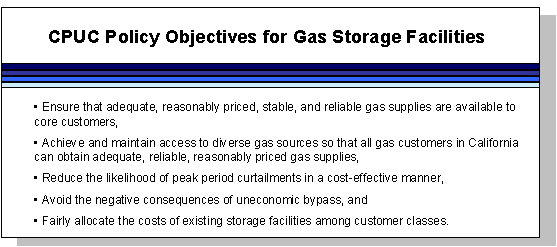
Restructuring efforts also affected storage infrastructure and intrastate natural gas transmission systems. In 1993, the CPUC "unbundled" noncore storage services.9 This action removed the utilities from the responsibility for providing storage services for noncore customers, and removed the cost of storage from noncore rates. To the extent noncore customers want storage from the utility, they must now directly contract and pay for such services. The CPUC also adopted specific storage reservation levels for the utilities' core customers. Finally, the CPUC adopted a "let the market decide" policy with regard to the construction or expansion of in-state storage facilities.
In 1997, the CPUC allowed customers and marketers to obtain capacity rights on PG&E's intrastate backbone natural gas transmission system,10 allowing them to match their interstate capacity with intrastate transportation capacity. The Commission is now considering whether to restructure the SoCalGas system to allow a similar approach in southern California.11
B. California's Natural Gas Primarily Comes from Out of State
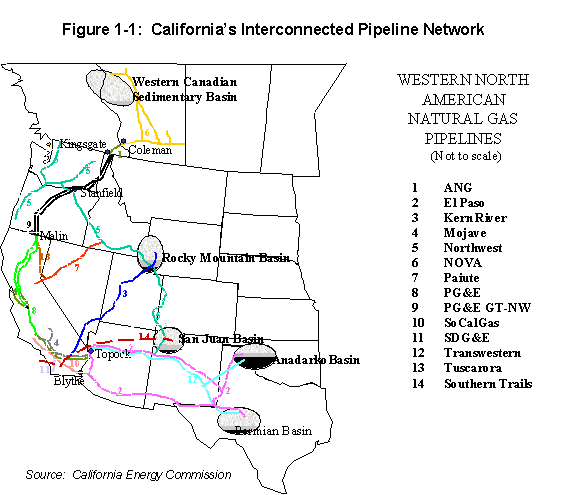
 California relies on a geographically diverse portfolio of natural gas delivered through an interconnected interstate pipeline system (see Figure 1-1). The following map shows the location of supply basins from which California receives its natural gas and the location of interstate pipelines that deliver gas to the state.
C. California Relies on Four Major Interstate Pipelines to Bring Gas to the California Border
Table 1-1: Interstate Pipeline Delivery Capacity to California
MMcfd
From the Southwest
El Paso Pipeline
-- Northern System @ Topock 2,080
-- Southern System @ Blythe 1,210
Transwestern Pipeline @ Needles 1,090
From the Rocky Mountains
Kern River Gas Pipeline 835
.
From Canada
PG&E Gas Transmission-Northwest12 1,972
TOTAL DELIVERY CAPACITY 7,187
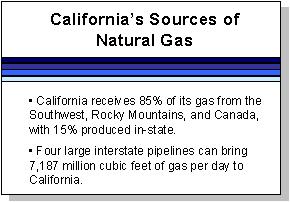
In addition to California's in-state natural gas production of about 1,000 million cubic feet per day (MMcfd), California relies on gas delivered through the El Paso, Transwestern, Kern River and PG&E interstate pipelines. These interstate pipelines are able to supply 7,187 MMcfd.13 14
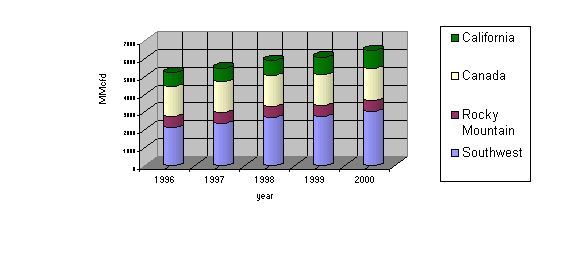
California's natural gas usage averaged 6,536 MMcfd in 2000. Figure 1-2 shows California's natural gas supply portfolio for the last five years.
Table 1-2: California's Gas Supply Portfolio in 2000
Source |
MMcfd |
Percentage |
Southwest |
3,041 |
47% |
Rocky Mountain |
596 |
9% |
Canada |
1,821 |
28% |
California |
991 |
15% |
Total |
6,53615 |
100% |
Source: 2001 California Gas Report
Figure 1-2: California Gas Supply Portfolio 1996-2000
 Source: 2001 California Gas Report
D. Utility Gas Transmission and Distribution Systems Take Gas From Interstate Pipelines to Consumers
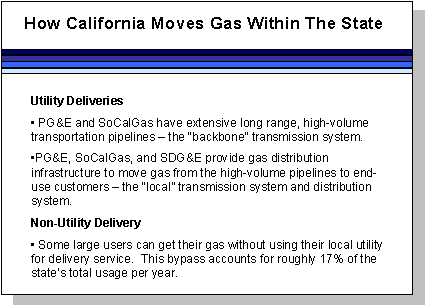 The utilities' gas transmission systems move gas from the border to customers. Compared to the 7,187 MMcfd of interstate pipeline delivery capacity to California currently in place, PG&E's and SoCalGas' backbone systems have a combined receipt capacity of as much as 6,100 MMcfd at their points of interconnection with the interstate pipelines. SoCalGas' backbone system expansion of 375 MMcfd, which will be completed by the 1st quarter of 2002, will add at least 250 MMcfd to California's receipt capacity, and up to 335 MMcfd.16 By November 2002, PG&E's expansion of Line 401, the Redwood Path, will increase California receipt capacity from interstate pipelines by an additional 200 MMcfd. With these expansions, the utilities will have a total of about 6,600 MMcfd of receipt capacity from interstate pipelines.
Bypass Pipelines17 Can Deliver Natural Gas Directly to Large End-Users or to the Utilities' Systems.
The Kern River Pipeline (835 MMcfd delivery capacity) and the Mojave Pipeline (400 MMcfd) connect at Daggett to become the Kern/Mojave pipeline within California. Of the total 1,235 MMcfd of capacity, Kern River and Mojave delivered 537 MMcfd in 2000 directly to end-users bypassing the utilities. In addition, Kern River delivered 250 MMcfd to SoCalGas and 52 MMcfd to PG&E. Mojave delivered 95 MMcfd to SoCalGas in 2000.
In-State Production Reduces the Amount of Infrastructure Needed.
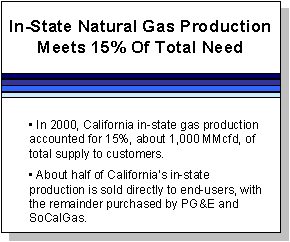 In-state California gas production has increased 25% over the last five years, from about 800 MMcfd in 1996 to about 1,000 MMcfd in 2000. The California Energy Commission estimates that California production has the potential to grow over the next two decades to over 1,200 MMcfd.
E. The PG&E, SoCalGas, and SDG&E In-State Gas Transmission Systems
PG&E'S Gas Transmission System
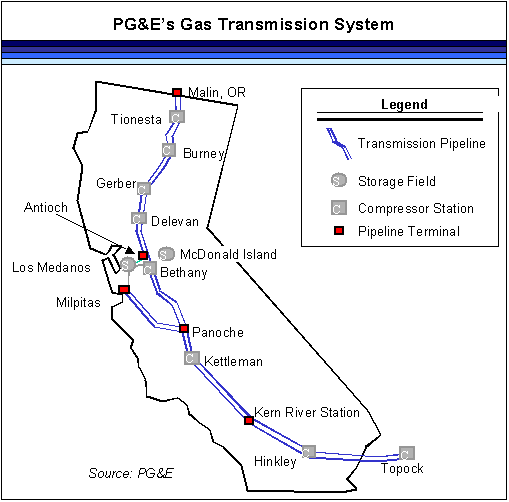 PG&E's gas transmission system capacity is greater than the average demand experienced in 2000. In the winter, PG&E can receive and deliver 3,375 MMcfd, 130% of its 2000 demand. In warmer seasons, PG&E can move 3,241 MMcfd, 128% of its 2000 demand. 18
PG&E gets the gas for its transmission system from three main points. Gas from the Southwest and Rocky Mountains is transported from the border with Arizona at Topock to Milpitas in the South Bay across the Baja Path19 (also called Line 30020). Gas from Canada is transported to the middle of California (Panoche and Antioch) via the Redwood Path (Line 400/401) from the Oregon border at Malin. The natural gas produced in California is transported along the Silverado Path. Table 1-3 shows the firm capacity and the "as-available" capacity on PG&E's system compared to the quantity of gas it can receive from the interstate pipelines.21
Table 1-3: PG&E's Transmission System Capacity (MMcfd)
Receipt Points |
Firm Capacity |
Summer As Avail |
Summer Total |
Winter As Avail |
Winter Total |
Southwest (Baja Path) El Paso Transwestern (Topock) Kern River GT (Daggett) Total Baja Path |
1,140 400 300 1,140 |
0 0 0 0 |
1,140 400 300
1,140 |
0 0 0 0 |
1,140 400 300
1,140 |
Canada (Redwood Path)22 |
1,803 |
98 |
1,901 |
232 |
2,035 |
California (Silverado Path) |
>200 |
N/A |
>200 |
N/A |
200 |
Total |
3,143 |
98 |
3,241 |
232 |
3,375 |
SoCalGas' Gas Transmission System
SoCalGas has sufficient capacity to meet the demand of its customers. SoCalGas can receive and deliver 3,500 MMcfd, 111% of its average 2000 demand with additional interruptible capacity23 of about 230 MMcfd. Table 1-5 shows the firm and interruptible24 capacity of SoCalGas' system from interstate pipelines and California production at receipt points in California.
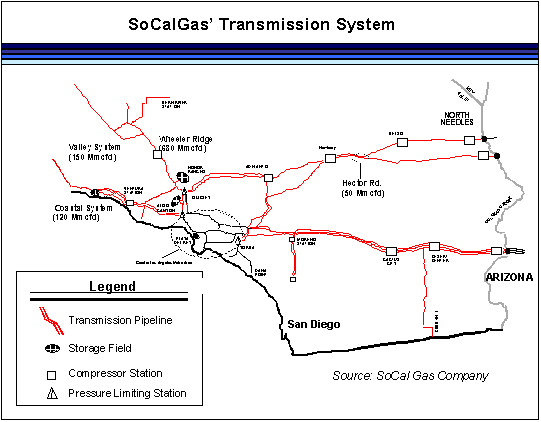
TABLE 1-4: SoCalGas' Transmission System Capacity From Interstate Pipelines and In-State Production
Receipt Points |
Firm Capacity (MMcfd) |
Interruptible Capacity (MMcfd) |
El Paso Topock (in AZ at AZ/CA Border) Blythe (Riverside County) |
540 1,21025 |
5 60 |
Transwestern Needles (San Bernardino County) |
750 |
50 |
Mojave Hector Road |
50 |
0 |
Kern/Mojave Wheeler Ridge |
680 |
120 |
California Production: Line 85 and Coastal |
270 |
60 |
|
Total |
3,500 |
23126 |
SDG&E's Gas Transmission System
SDG&E takes delivery from SoCalGas as a wholesale customer. Natural gas enters the SDG&E system through its connections to the SoCalGas system at the Rainbow and San Onofre Metering Stations. Maximum capacity at the Rainbow Station is 635 MMcfd in the winter and 615 MMcfd in the summer. The San Onofre Station capacity is about 30 MMcfd.
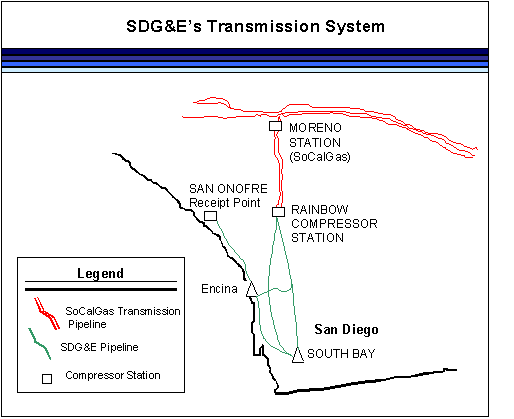
SDG&E's maximum natural gas transmission system capacity is 665 MMcfd in the winter and 645 MMcfd in the summer. With an operational reserve margin27 of 45 MMcfd, SDG&E's winter capacity is 620 MMcfd, and summer capacity is 600 MMcfd.28
SDG&E currently delivers natural gas to Mexico for electric generation facilities at the Presidente Juarez Power Plant in Rosarito, Mexico. SDG&E may reduce deliveries to the Rosarito facility in September 2002, if the North Baja pipeline is operational. This new interstate pipeline would deliver Southwest gas from the California/Arizona border to the Mexico border at Yuma, Arizona.
F. Non-Utility Deliveries from Bypass Pipelines and California Producers Supplied 17% of the Natural Gas Consumed in California
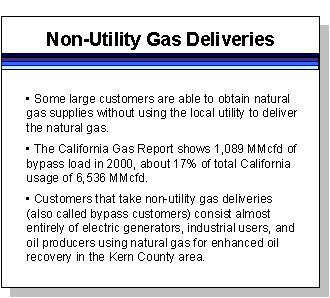 Bypass pipelines affect the CPUC's regulation of the local distribution utilities. New bypass pipelines provide additional infrastructure to serve California's gas demand. If large gas users leave the utilities' system to take service from a bypass pipeline, the utilities may be left with stranded investment in capacity that had been built to meet that former load. As a result, the CPUC may have to raise rates for the utility's remaining customers to pay for this stranded infrastructure, or utility shareholders may have to write off the cost of the investment. Thus, although some customers may benefit from lower rates by taking service from a bypass pipeline, others may have to pay more. The CPUC has tried to address this problem through its rate design and cost allocation policies to minimize the "uneconomic" bypass of the existing utility system.
Traditionally, oil producers and refiners using California-produced natural gas in their own operations have bypassed the utilities. California producers sold about half (552 MMcfd) of their gas production directly to end-users in 2000.
The Kern River and Mojave pipelines were the first interstate pipelines to provide direct service to large gas users within California. The Kern River/Mojave pipeline made direct deliveries of 537 MMcfd in 2000 to end-users.
 G. California's Storage Improves System Reliability and Price Stability
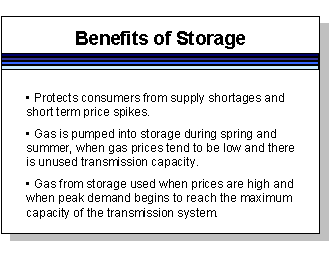
Natural gas storage is used to meet peak demands reliably and as a hedge against market price fluctuations for gas. Natural gas demand changes with weather, power generation requirements, economic activity, and other factors.
Utilities must reserve a specified amount of storage capacity for their core customers. Since 1993, utilities have not been responsible for ensuring that noncore customers have reserved adequate storage capacity to meet their natural gas requirements. If noncore customers want storage services they must contract directly with a storage provider.
Utility Storage Fields
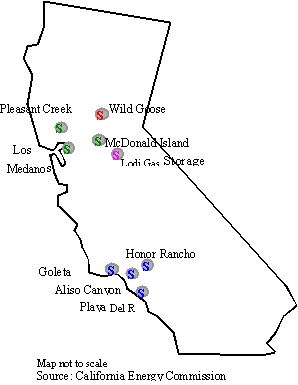
PG&E's storage fields include the Pleasant Creek, McDonald Island, and Los Medanos storage facilities in Northern California. SoCalGas owns Honor Rancho, Goleta, Aliso Canyon, and Playa Del Rey storage facilities in Southern California. SDG&E contracts with SoCalGas for 5,900 MMcf of inventory capacity, with 27.7 MMcfd of injection capacity and 222 MMcfd of withdrawal rights.
Independent Storage
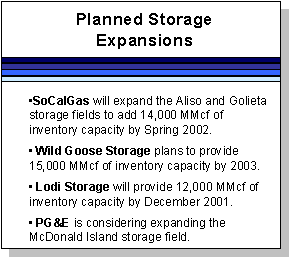
Two independent storage operators, Wild Goose Storage Inc.29 and Lodi Gas Storage, L.L.C.30 provide service to noncore customers, shippers and marketers. Lodi Gas Field is scheduled to be fully operational in December 2001.
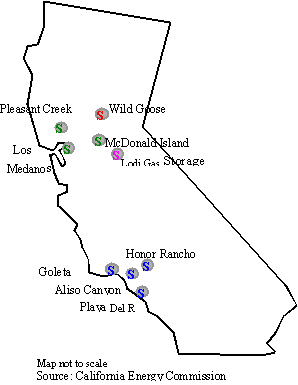
Figure 1-6: California's Natural Gas Storage Facilities
Table 1-5: Natural Gas Storage Capacity in California
|
Storage Facilities |
Inventory Capacity (MMcf) |
Injection Capability (MMcfd) |
Withdrawal Capacity (MMcfd) | |||
Core |
Total |
Core |
Total |
Core |
Total | |
PG&E |
32,800 |
40,500 |
200 |
230 |
1,006* |
1,341 |
SoCalGas |
70,000 |
105,600 |
327 |
803 |
1,985** |
3,740 |
Wild Goose |
14,000 |
80 |
200 | |||
Lodi TOTAL |
102,800 |
12,000 172,100 |
527 |
400 1,513 |
2,991 |
500 5,781 |
*PG&E's core withdrawal capacity can meet about 31% of core Abnormal Peak Day (APD)31 demand.
**SoCalGas' core withdrawal capacity can meet about 63% of core Extreme Peak Day (EPD) 32demand.
H. CPUC Has Identified Where Infrastructure Improvements Are Needed, and Projects Are Progressing
CPUC Approval Process for New Natural Gas Facilities
The CPUC reviews proposed natural gas infrastructure improvements, and determines how customers will pay for any utility additions. In formal proceedings, proposals for utility infrastructure additions are examined to ensure that they are in the public interest. If the CPUC finds the proposal to be beneficial, it then scrutinizes the costs for the addition, and sets appropriate rates for the utility to recover those costs
If all utility customers benefit from the new capacity, the costs may be "rolled in" to the utility's rate base, and paid for equally by all customer classes. If the rate base addition benefits a small group of customers, or marketers, the incremental costs of the new facilities may be charged exclusively to those using the new capacity. The CPUC may also find that the utility should be put at risk for recovery of the costs of an addition.
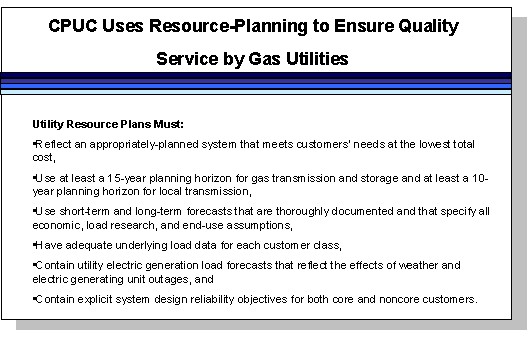
In proceedings called Biennial Cost Allocation Proceedings (BCAPs), the CPUC allocates the utility's authorized revenue requirement, and designs rates for the various classes of customers, i.e. residential, commercial and industrial customers. In a BCAP, the utility typically presents its "Resource Plan," which shows the utility's planned transmission and storage additions for a fifteen-year period.
Criteria For Authorizing New Capacity
The CPUC has adopted broad, general criteria for new pipeline capacity. Following the curtailments in the late 1980s, the CPUC concluded that "slack capacity" of 10% in the near-term and up to 20% in the long-term (based on cold-year throughput forecasts) would "support the unbundled gas service structure, foster competition (gas-on-gas and pipeline-to-pipeline), and achieve a higher level of reliability of gas service in California."33 These criteria required new pipelines to be "economically justifiable," and to promote "supply diversity." The CPUC did not endorse the construction of any specific interstate pipeline, and instead left it up to the market to decide which pipelines the market would support.
Utility Transmission System Expansions Already Underway
PG&E is increasing its capacity by 6% with a 200 MMcfd expansion of the Redwood Path (expected to be completed by November 1, 2002).
SoCalGas is adding 375 MMcfd in four separate expansions to its transmission capacity. These expansions are expected to be in service in the first quarter of 2002.34
SDG&E has proposed a pipeline from Poway to Santee to add about 20 MMcfd to SDG&E's system capacity.
Storage Expansions Provide Additional Reserve Capacity
SoCalGas
SoCalGas plans to increase the capacity of the Aliso Canyon and Goleta storage fields by 14 Billion cubic feet (Bcf) by Spring 2002. The average maximum injection capacity at these fields will increase by about 7% to 8% as a result of these expansions. The cost of this project is estimated at $16 million.
 SoCalGas closed the Montebello storage facility earlier this year. The total recoverable gas in this facility is 23 Bcf. SoCalGas will withdraw 14 Bcf in 2001-2002. This withdrawal will continue for the next five years for the remainder of the cushion gas. Although not an addition to infrastructure, this one-time event will add about 50 MMcfd to SoCalGas' available supplies over the next year, and smaller amounts in subsequent years. SoCalGas delivered 2.7 Bcf to core customers in 2001 and will market the balance to noncore customers and marketers.
PG&E
PG&E is considering an expansion of its McDonald Island storage field. This expansion would require the installation of new pipeline from the storage field to PG&E's transmission system.
Wild Goose Storage Expansion
Wild Goose plans to increase the storage capacity of its facility from 14 to 29 Bcf, with maximum injection from 80 to 450 MMcfd, and maximum withdrawal from 200 to 700 MMcfd by 2003.
New Interstate Pipelines Will Further Enhance Natural Gas Delivery to California
Some New Interstate Pipeline Projects Have Broken Ground.
Eight interstate pipeline projects, representing more than 1,900 MMcfd of additional capacity to serve the California natural gas market, are underway. Table 1-6 shows the interstate pipeline projects that are anticipated.
Table 1-6: Proposed Interstate Pipeline Additions
(Approved by FERC or Contract Signed)
Name |
Location |
Capacity (MMcfd) |
On-line Date |
Status |
1. Transwestern-Red Rock, Southwest |
San Juan & Permian Basins to CA/AZ border at North Needles and Topock |
150 |
June 2002 |
FERC approved July 2001. |
2. Questar Southern Trail East Zone, Southwest |
San Juan Basin to CA/AZ border at North Needles |
80 |
June 2002 |
FERC approved. Contracts signed. |
3. El Paso Plains- All American Pipeline, Southwest |
Conversion of oil pipeline to gas, San Juan & Permian Basins to CA/AZ border at Blythe |
230 |
Mar 2002 |
FERC conditionally approved May 2001. |
4. Kern River Gas Transmission, Rocky Mountains |
Opal, WY to Wheeler Ridge, other CA delivery points (e.g., Kramer Junction & Daggett), Nevada, and Utah |
146 |
May 2002 |
FERC approved. Contracts signed. |
5. PG&E GTN, Canada |
Kingsgate to CA/OR border at Malin, 21 miles of loop. |
169 |
July 2002 |
FERC approved. Contract signed. |
6. Otay Mesa Generating Company Pipeline, Mexico |
From North Baja pipeline to Otay Mesa Power Plant in San Diego County, CA |
110 |
Sep 2002 |
FERC granted Presidential permit July 2001. |
Total 200235 Additions |
885 |
|||
7. Kern River Gas Transmission, Rocky Mountains |
Opal, WY to Wheeler Ridge, other CA delivery points (e.g., Kramer Junction & Daggett), Nevada, and Utah |
885 |
May 2003 |
FERC application filed Aug 2001. Contracts signed |
8. PG&E GTN, Canada |
Kingsgate to CA/OR border at Malin |
80 |
Nov 2003 |
FERC application Nov 2001. Contract signed. |
Total 2003 Additions |
965 |
|||
Total Expansions 36 |
1,850 |
Some Pipelines Are A Long Way From Getting Started.
There are a number of pipelines that are currently only in the preliminary planning stages. These proposed additions still have to go through FERC approval, receive the necessary environmental permits, find customers willing to contract for the new capacity, and get financing from private firms contracting for the new capacity. These projects are shown in Table 1-7.
Table 1-7: Expansion Proposals That Are In The Early Stages
Name |
Location |
Capacity MMcfd |
On-line Date |
Status |
1. Transwestern-Sun Devil, Southwest |
San Juan Basin to CA/AZ border at North Needles |
TBD |
TBD |
FERC application expected mid-2002. Negotiating contracts. |
2. El Paso Southern System Expansion, Southwest |
Permian Basin to CA/AZ border at Blythe |
320 |
TBD |
Not fully committed in open season. Evaluating options. |
3. Kinder Morgan-Sonoran Pipeline Phase 1, Southwest |
New Mexico to North Needles |
750 |
Summer 2004 |
FERC application Spring 2002. Negotiating contracts. |
4. Ruby Pipeline, Rocky Mountains |
New pipeline from Southwestern WY to Sacramento, Stockton, and Antioch |
750 |
Dec 2004 |
FERC application in mid 2002. Negotiating contracts. |
5. Questar Southern Trail West Zone, In-State |
North Needles to Long Beach |
TBD |
TBD |
FERC approved. |
6. El Paso Bi-directional Lateral, In-State |
Blythe to Daggett |
TBD |
TBD |
Not fully committed in open season. Evaluating options. |
7. Kinder Morgan-Sonoran Pipeline Phase II, In-State |
North Needles to Bay Area |
1,000 |
TBD |
FERC application Spring 2002. Negotiating contracts. |
8. Mojave Sacramento Valley, In-State |
Topock to Sacramento Valley |
TBD |
TBD |
Project on hold. |
Liquefied Natural Gas Proposals Are A Distant Possibility, and May Not Yield Any Benefits During the Next Five Years
There are several private firms that are exploring the feasibility of transporting liquefied natural gas. These proposals are only in conceptual stages.
Sempra Energy, in partnership with CMS Energy Corporation, is considering building LNG facilities in Baja Mexico. With a tentative in-service date of 2005, the project could supply 1,000 MMcfd at an estimated capital cost of $500 million. 37
B.B. InterCapital38 submitted a proposal to the Power Authority to build a 1,400 MMcfd LNG facility in Baja California to import natural gas from Bolivia. B.B. InterCapital is asking the Power Authority to finance the entire projected capital costs of about $5.75 billion through the issuance of bonds.
El Paso Corporation and Bechtel Enterprises are also considering building LNG facilities in Mexico or in California.
CHAPTER 2
LEARNING FROM THE EVENTS OF 2000 -- 2001
A. A Combination of Unusual Events Led to Extremely High Natural Gas Prices and Supply Shortages in 2000-2001
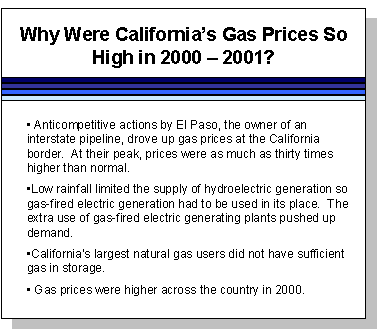
The skyrocketing prices experienced in California in 2000 and 2001 caught consumers and natural gas experts by surprise. Over the last decade, California's customers had enjoyed relatively stable gas prices from year to year, with sufficient capacity to meet their needs.
 In 2000 and 2001, a combination of factors drove prices through the roof and threatened the reliability of the gas infrastructure.
The Role of the El Paso Contract
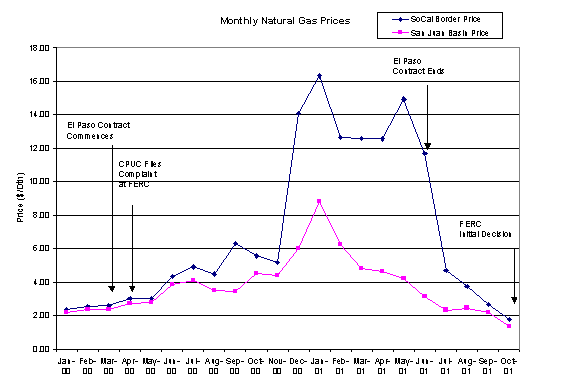
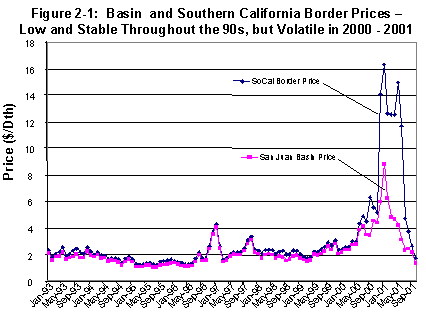
Historically, the price of natural gas sold at the southern California border closely tracked the San Juan Basin price. That all changed following El Paso Merchant Energy's acquisition of 1,220 MMcfd of El Paso pipeline capacity in March 2000. As shown in Figure 2-1, the price at the California border began to reflect a huge mark-up from the San Juan Basin price by the summer of 2000. The daily spot price of gas at the southern California border reached as high as $60 per decatherm39 (Dth) in early December 2000, compared to the $8 to $11 per Dth price in the San Juan Basin.
The CPUC was concerned that the El Paso contract would hurt California consumers and only a month after the contract was awarded, the CPUC filed a complaint at the FERC. In the April 4, 2000 complaint, the CPUC argued that the fifteen-month contract between El Paso (the owner of the pipeline) and El Paso Merchant Energy (an affiliate of El Paso) had the potential for market power and affiliate abuse. In the October 9, 2001 Initial Decision on the CPUC v. El Paso complaint, the FERC Administrative Law Judge (ALJ) agreed that El Paso violated the FERC affiliate abuse regulations and that El Paso and El Paso Merchant had the ability to exercise market power. However, the ALJ found that there was not clear evidence that they exercised market power, and the CPUC has appealed this finding to the FERC. The CPUC is continuing efforts to have El Paso pay refunds to California consumers associated with its unjust and unreasonable actions. In the meantime, the California Assembly Subcommittee on Energy Oversight also found that "The [El Paso] contract provided [El Paso Merchant Energy] market power that could be exploited to artificially increase prices."40
The fluctuations in natural gas spot prices at the California border through 2000-2001 make it clear that the market power the CPUC was concerned about was indeed responsible for the soaring prices. Shortly after the El Paso Merchant contract expired on May 31, 2001, California border prices once again corresponded to San Juan Basin prices. Figure 2-2 illustrates 1) the dramatic increase in the differential between the California border price and the San Juan basin price following the commencement of the El Paso contract, and 2) the decrease in the differential after the El Paso contract ended.
The increase in California border prices caused by the anti-competitive El Paso contract likely was exacerbated by concurrent developments in the gas market. Gas demand for electric generation escalated from the summer of 2000 through the spring of 2001. In August 2001, an explosion on the El Paso Pipeline temporarily reduced capacity on that pipeline for a couple of weeks. Adding to the stress on the pipeline delivery system, noncore customers, including electric generators, did not inject enough natural gas into storage during the spring to fall of 2000. Consequently, these customers met their higher demand by making incremental gas purchases, rather than drawing on storage.
Figure 2-2: California Border Prices Increase in 2000-2001
Because of El Paso Contract
Increased Demand From Gas-Fired Electric Generating Plants Helped Push Gas Prices Higher in 2000
California's natural gas infrastructure was able to absorb the growth in demand from 1996 to 2000, but incremental demand of gas-fired electrical generation stressed the system in 2000-2001. California's demand for natural gas grew a substantial 22% from 1996 to 2000, from 5,343 MMcfd in 1996 to 6,536 MMcfd in 2000, or about 5% per year.41 California's natural gas transmission infrastructure readily accommodated the increased deliveries due to the over-building of the interstate and backbone transmission system in the early 1990s.
Low precipitation in 2000 and 2001 in California and the Pacific Northwest limited the amount of hydroelectric generation available to California. When California's restructured electricity market began to collapse in May 2000, gas demand from gas-fired power plants soared. In the first five months of 2001, PG&E and SoCalGas' deliveries jumped nearly 20% over the previous year (almost 1,000 MMcfd). SDG&E was forced to curtail some noncore natural gas customers in the winter of 2000-2001, because of unusually high electric generation demand.
Following the stabilization of California's electricity market and the recent addition of new gas infrastructure to ease system bottlenecks, the pressure on California's gas transmission system diminished. The reduction in demand for gas by gas-fired electric generators led to an 11% reduction in gas demand on the SoCalGas system for the months of June through September in 2001.
Large Noncore Consumers Did Not Make Good Use of Storage
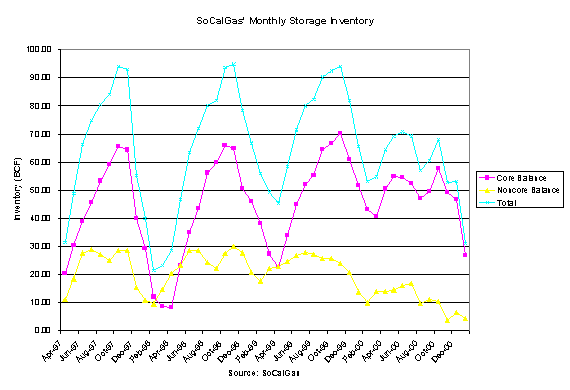
Utilities are not responsible for ensuring that noncore customers have reserved adequate storage capacity to meet their natural gas requirements. Noncore customers did not inject as much gas into storage as they could have in 2000, particularly on the SoCalGas system, as shown in Figure 2-3. Later in the year, as electric generation demand rose, these customers could not rely on stored gas to meet their increased demand. Instead, the electric generators increased natural gas pipeline deliveries to California, causing usage of the utility backbone natural gas transmission systems to significantly increase.
Nonetheless, the storage reserves maintained by PG&E and SoCalGas provided overall system reliability, and enabled them to meet all customer demand (noncore, as well as core) in 2000 and 2001.
In response to concerns that noncore customers were not injecting adequate supplies of natural gas into storage, the CPUC initiated a proceeding, Order Instituting Rulemaking 01-03-023, to consider whether it should revise storage rules for noncore customers.42
Figure 2-3: SoCalGas Storage Levels Show Noncore Storage
Below Normal in 2000
Natural Gas Prices Tripled Across North America in 2000
Through the 1990s, the basin price of natural gas was relatively low and stable, fluctuating between about $1.50/Dth and $3.50/Dth (about $1.50 to $3.50/Mcf). The San Juan Basin price shown in Figure 2-1 exemplifies the overall trend. Canadian gas prices followed a similar pattern, but generally undercut Southwest gas prices. In late spring 2000, natural gas prices began to climb across North America, more than tripling by the end of the year, both at the wellhead and at various price points where gas is delivered by the interstate pipelines.
In contrast to the price increase at the California border, the run up in the basin price of natural gas in North America in 2000 is a classic example of basic supply and demand. A decade of low prices gave gas producers little incentive to invest in new production. Economic growth in the late 1990's, coupled with low levels of gas in storage in 2000, contributed to the imbalance between supply and demand.
B. The Dramatic Increase in the California Border Price Was Not Caused By Inadequate Natural Gas Infrastructure in California 43
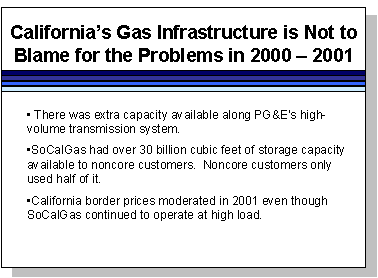
California's gas infrastructure is able to meet the needs of California's customers, and was not responsible for the high prices experienced in 2000 - 2001.
PG&E's intrastate pipeline connected to the southern California border was not running at full capacity. PG&E's Line 300, the Baja Path, taking delivery from El Paso at Topock, had excess capacity when the price increases occurred. The Baja Path rarely runs at full capacity.
SoCalGas' storage, capable of storing over 100 Bcf of gas and withdrawing over 3 Bcf of gas per day, had over 30 Bcf of storage capacity available for noncore customers. On June 1, 2000, noncore customers held only 14 Bcf of gas in storage. By November 1, 2000, noncore storage had dropped to 10 Bcf. This compares to 25 Bcf and 26 Bcf, respectively, for 1999. If noncore customers had injected more gas into storage (fully utilizing the available infrastructure), then it would not have been necessary to use intrastate pipelines at such high levels later in 2000-2001.
SoCalGas' transmission capacity continued to operate at high load levels throughout the summer of 2001 (i.e. right after the El Paso contract ended), as core and noncore customers injected gas into storage. Nonetheless, the California border price dropped from $10.20/Dth on May 31, 2001 (the day the El Paso contract expired) to $2.57/Dth on August 31, 2001. This indicates that, rather than an "infrastructure shortage" driving up border prices, the anti-competitive El Paso Merchant Energy contract caused the price escalation at the California border.
C. Positive Outlook for Natural Gas System As we Go Into Winter 2001 - 2002
Demand dropped off later in the summer and fall of 2001 as California's natural gas demand has been lower than was expected earlier this year. The storage fields of both PG&E and SoCalGas are at full capacity as they head into the winter heating season. Core storage is higher than the winter of 2000-2001, and reached its November 1st storage target of 70 Bcf. Noncore customers injected much more natural gas into storage this year. As of November 15, 2001, total SoCalGas storage inventory is nearly 114 Bcf, its highest level in at least the last five years.
CHAPTER 3
 STATE AND UTILITY FORECASTS FOR 2002 TO 2006
A. California's Natural Gas Infrastructure Can Meet Forecast Demand Under Adverse Weather Conditions
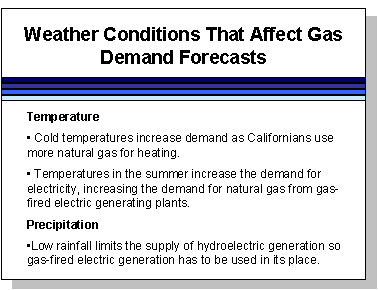
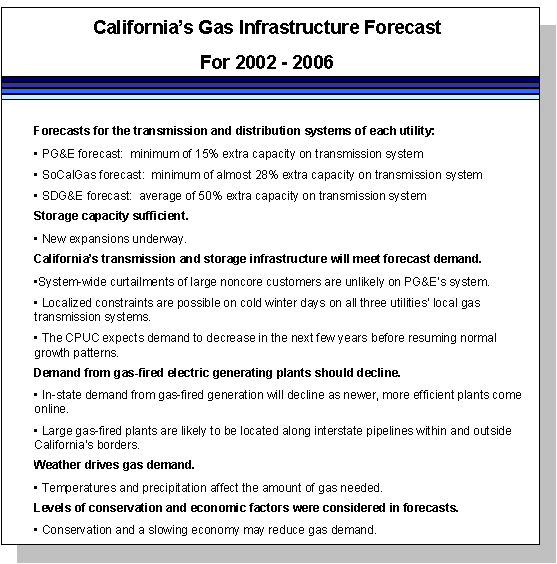
California's natural gas transmission system for all three utilities will operate at less than 80% of total system capacity over the next five years under average temperatures and normal winter precipitation.44 Even under the adverse weather conditions of a cold winter and low hydroelectric availability, the average slack capacity would be at least 15%.

In dry years, reduced hydroelectric production in the Western states leads to increased gas-fired electric generation to meet electric demand. Colder than normal winter weather drives up natural gas demand for home heating. Hot summer weather increases electricity demand for air conditioning, and in turn natural gas used by electric generators.
The CPUC analyzed recorded demand figures over the past five years along with demand forecasts through 2006 under a variety of weather conditions. This analysis examined the ability of the gas infrastructure to meet demand under a range of temperatures in combinations with assumptions of high- and low-precipitation. These scenarios capture a very broad range of conditions.
The National Weather Service's latest precipitation forecast indicates that there is an equal probability of above average, normal, and below average precipitation through the winter of 2002-2003. It also shows there is an equal probability of warm, average, or cold temperatures over the same period.
Utilities' Gas Infrastructure Is Designed to Provide Reliable Service to Core Customers Even Under Extreme Stress.
The utilities design their natural gas systems to provide reliable service to residential and small commercial customers even under extreme weather conditions. SoCalGas' storage can be used to avoid system-wide curtailments for noncore customers, as well as core customers, even under extreme peak day conditions. PG&E's current natural gas backbone transmission and storage system cannot assure service to all noncore customers on very cold days. These very cold days have a probability of occurrence of between once in twenty years and once in ninety years. With the use of Wild Goose storage and Lodi storage, and the expansion of Redwood Path capacity, the likelihood of curtailments on PG&E's system even under these conditions will be reduced.
Under less extreme conditions, localized constraints may develop on the utilities' local natural gas transmission systems during periods of very cold weather. Such local constraints would not affect customers on a system-wide basis. Rather, the constraint would affect the relatively small number of noncore customers located in that particular area for, at most, a few days (see Table 3-1).
Table 3-1: Potential Constraints on Utility Systems
Constraints Expected Only Under Adverse Conditions and
Likely to Be Limited in Scope
Potential Constraint |
PG&E |
SoCalGas |
SDG&E |
Backbone Transmission & Storage System |
Very Cold Days, once every twenty to ninety years |
No constraints up to conditions expected once every 35 years |
Not applicable |
|
Local Transmission System |
Cold Days, once every four years |
San Joaquin Valley, Imperial Valley, once every ten years |
Very Cold Days, once every 20 to 35 years* |
* After 2002, assumes North Baja Pipeline constructed
California's Largest Customers Have Chosen Lower Rates in Exchange for Slightly Less Reliable Service.
The utilities' systems are currently designed to ensure service to core customers, even under extreme weather conditions. Although the utilities design their systems to provide highly reliable service for large noncore customers, California's largest gas consumers have low rates partly in exchange for the very infrequent chance of a short curtailment. Capacity in areas subject to potential local constraints during the forecast period could be expanded, depending on system design criteria, the level of service required by noncore customers, and customers' willingness to pay for higher levels of reliability. The CPUC is addressing these issues in our current investigation into SDG&E's and SoCalGas' natural gas transmission system, and will continue to evaluate these issues in upcoming utility rate-setting proceedings.
B. Demand from Gas-fired Electric Generating Plants Should Decline
Gas-fired power plants used about 44% of all gas consumed in California in 2000. A substantial number of new efficient gas-fired power plants will be coming online in the next few years, displacing the power produced from the state's portfolio of 30- to 40-year old gas-fired steam plants and old peaking units.45 A return to normal levels of hydroelectric capacity would also contribute to a decrease in gas demand relative to recent natural gas demand. Gas demand by electric generators within the state may be further diminished if new power plants under construction in neighboring states sell some of their power into California.46
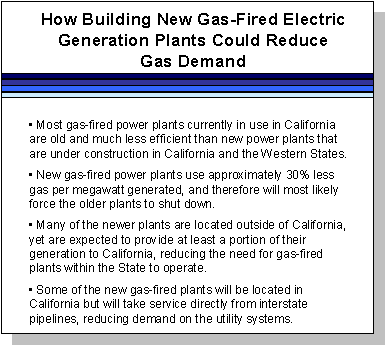 On average, the new gas-fired power plants are over 30% more efficient than existing plants.47 Figure 3-1 shows the comparative fuel efficiency advantage of the new gas-fired plants. In Southern California, the heat rate of every major power plant now served by SoCalGas exceeds the typical heat rate of a new power plant.48
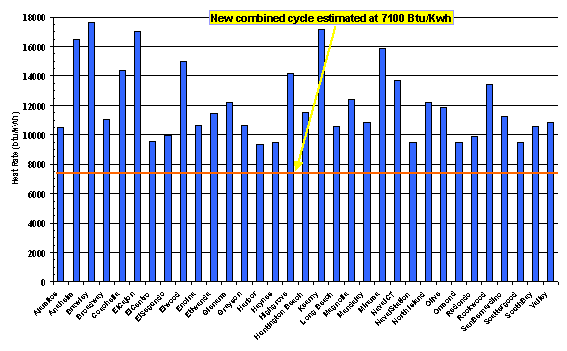
Figure 3-1: Heat Rates of SoCalGas-Served Power Plants Show that California Gas Demand Will Likely Decrease as New Plants Come On-Line
Source: Southern California Gas Company, September 2001.
The location of new gas-fired generation will have an affect on where natural gas is consumed. Most of the proposed gas-fired plants are expected to be located along interstate pipelines, which may increase the amount of gas available within the state. The map below (Figure 3-2) shows approximately 10,000 MW of new generating capacity proposed along the path of the Kern River pipeline, which is currently expanding its system by 885 MMcfd. Most of the new proposed plants along the Kern River pipeline could be served by the proposed Kern River expansion with no significant diversion of capacity currently serving California. Kern River could serve power plants located out-of-state or within California, but off the utilities' systems.
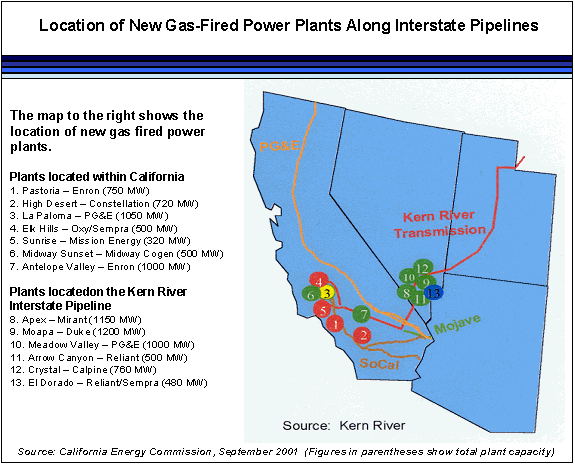 Figure 3-2
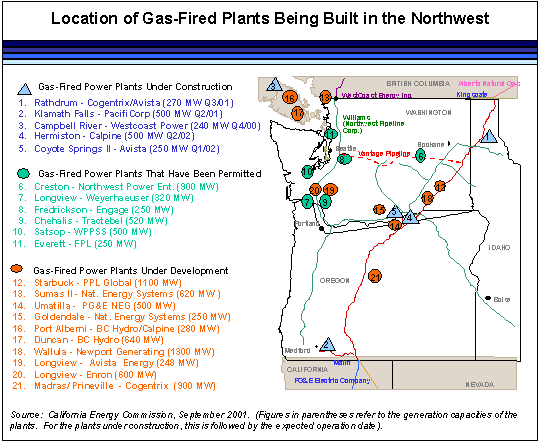 The map below (Figure 3-3) shows a similar pattern in the Northwest, with many of the proposed power plants located along the path of the PG&E -GTN pipeline.49
Figure 3-3
The CPUC is concerned that the extensive construction of new gas-fired power plants located upstream from California on interstate pipelines could reduce the amount of gas that can reach California.50 In addition, we have no guarantee that the power generated by new plants outside California will be sold in California. If power generated by new plants outside California is sold elsewhere, gas-fired generation within California will be higher as will gas demand to serve those plants.
C. Conservation and Economic Uncertainty Affect Gas Demand
Conservation of both natural gas and electricity, consumer response to higher electric and gas rates, and economic conditions are other important variables affecting forecasts of electric generation and overall natural gas demand during the five year forecast period. As the Department of Energy's Energy Information Administration noted in a report on natural gas market trends, "Economic growth leads to growth in housing starts, commercial floor space, disposable income, and industrial output, all of which lead to growth in energy consumption."51 On the other hand, a slowdown in economic growth leads to a relative decrease in gas demand. In a recent presentation, the Department of Energy noted that a key assumption behind its current natural gas outlook was that the economic slowdown nationally was limiting gas demand.52
SoCalGas stated in recent testimony filed in Application (A.) 01-09-024, that "(T) he load reduction programs implemented by the State of California coupled with high electric rates and an economic downturn have reduced the growth in electric end-use demand." Based on input from industry sources, SoCalGas estimated the electric demand reduction in 2001 for the California [regulated gas utilities] to be 9%. We calculate the actual average electric generation gas demand on SoCalGas' system from June 2001 through September 2001 to be almost 15% lower than during the same period in 2000.
D. Forecasts for 2002-2006 Indicate That California's Natural Gas Infrastructure Will Be Adequate During the Next Five Years Under Likely Weather and Hydroelectric Scenarios
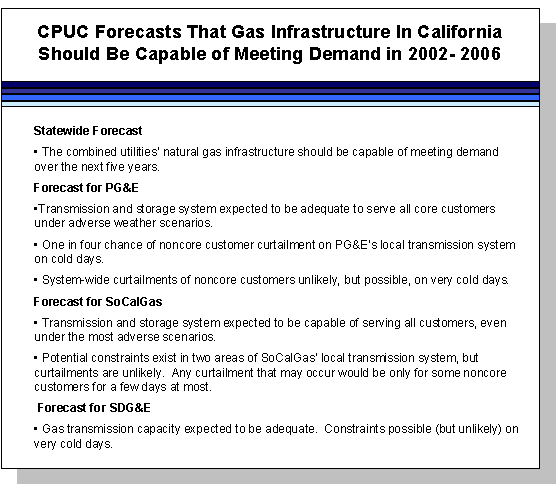
Statewide Forecast
Even under highly unlikely weather conditions, California's utilities should have ample capacity to meet customer demand. Table 3-2 shows the slack capacity associated with gas demand forecasts under numerous weather scenarios, including the simultaneous occurrence of a dry hydro condition with a hot or cold temperature year.53 These forecasts, under a wide variety of scenarios, indicate that California's pipeline and storage system will be sufficient to provide a high level of reliability through at least 2006.
Table 3-2: Slack Capacity Under Different Weather Scenarios Shows Adequate Backbone Transmission Capacity through 2006
Scenarios |
PG&E |
SoCalGas |
SDG&E |
Statewide |
Average Temperature, Normal Hydro |
29% |
37% |
49% |
27% |
Average Temperature, Dry Hydro |
17% |
31% |
46% |
20% |
Cold Temperature, Normal Hydro |
27% |
33% |
47% |
25% |
Cold Temperature, Dry Hydro |
15% |
28% |
44% |
17% |
Hot Temperature, Normal Hydro |
30% |
38% |
51% |
28% |
Hot Temperature, Dry Hydro |
18% |
33% |
48% |
19% |
Note: CPUC Calculations Based on Utility Forecasts of Natural Gas Demand, August-October 2001
California's gas utilities do not serve all gas demand in California. Some of the gas deliveries in California bypass the utility systems, either via the Kern River/Mojave interstate pipeline system, or via direct delivery from California producers. Bypass deliveries over the 1996-2000 period have been steady at approximately 1,000 MMcfd. In 1999 and 2000, roughly half of bypass deliveries have been in-state producers, and the other half was transported off the Kern River and Mojave interstate pipelines. 54
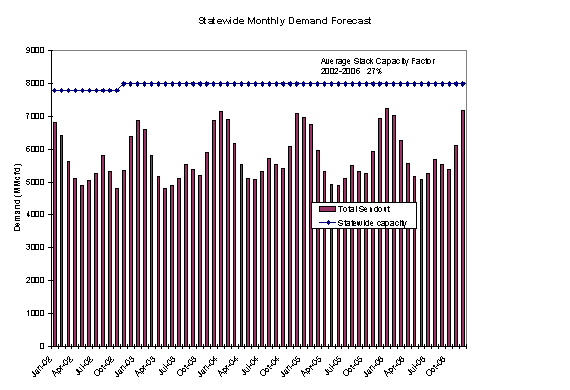
CPUC estimates of statewide deliveries for 2002 - 2006 are based on the utilities' forecasts of gas demand, PG&E's forecast of bypass deliveries from the 2000 California Gas Report, and SoCalGas' updated forecasts of bypass deliveries. Figure 3-4 compares these estimates to statewide transmission capacity, under average temperatures and normal hydro conditions.55 The CPUC did not adjust forecasts of bypass deliveries under different temperature scenarios, or to account for dry hydro conditions.
Figure 3-4: Combined Utility and Bypass Demand Forecasts Show Adequate Statewide Natural Gas Transmission Capacity
 Source: Calculations by CPUC, based on forecasts from PG&E, SoCalGas and SDG&E, and data
from the California Gas Report
The planned expansions of intrastate natural gas transmission capacity (for example by Kern River56), the proposed expansion of Wild Goose storage capacity, and the operation of the Lodi storage field will further enhance the ability of the state's natural gas transmission and storage infrastructure to meet demand.
The CPUC notes that the statewide natural gas demand forecast prepared by the CEC57 closely agrees with the combined statewide forecasts prepared by the regulated California utilities.58 The CEC demand forecast, shown in Figure 3-5, indicates an average statewide slack capacity of 23%; the utility-based forecast indicates a slack capacity of 27%.
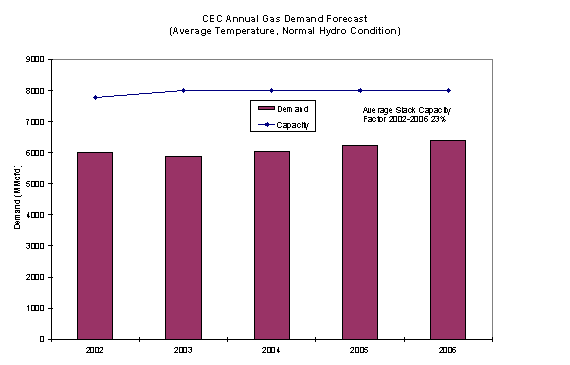 Figure 3-5: CEC Forecast Shows California's Natural Gas Infrastructure Able to Meet Demand
Source: CEC provided demand figures. Non-electric generation demand, June 2000,and electric generation demand, August 2001. CPUC staff derived the slack capacity factors.
PG&E's Natural Gas Transmission and Storage System
PG&E's average natural gas transmission slack capacity will be about 29% under normal conditions during the forecast period (See Table 3-2).59 Even under adverse weather conditions, PG&E slack capacity will be around 15%. Storage provides seasonal reliability for periods when daily and monthly demand exceeds natural gas transmission capacity. Wild Goose storage and Lodi storage facilities are also available to gas consumers and marketers serving customers within PG&E's service area.
Natural gas demand in PG&E's service area will decrease from levels experienced in 2000-2001, if hydro conditions return to normal and demand for gas-fired generation decreases as expected. Figure 3-6 shows PG&E's forecasted monthly demand, including off-system demand, under average temperatures and normal hydro conditions compared to PG&E's firm intrastate transmission capacity.60 61 PG&E's forecast natural gas demand under scenarios other than average temperatures and normal hydro conditions confirm that PG&E's gas infrastructure will provide a high level of service for all customers through 2006.
This CPUC's capacity analysis for PG&E is conservative in that the slack capacity figures shown on Table 3-2 for PG&E only include firm natural gas transmission capacity. Depending on operating conditions, PG&E typically has up to 100 MMcfd of additional interruptible capacity available in the summer and 200 MMcfd in the winter. On the other hand, the CEC has indicated that PG&E receipts of natural gas at Malin during periods of cold weather may be reduced due to increased demand in the Pacific Northwest and Canada.
Figure 3-6: PG&E's Intrastate Transmission Capacity
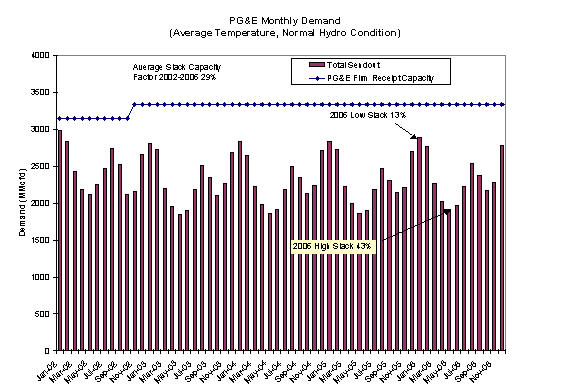 Can Meet Demand Over the Next Five Years
Source: Demand Forecast from PG&E, August 2001
 The CEC forecasts less slack capacity for the PG&E system than PG&E's internal forecasts under average temperatures and normal hydro conditions.62 The CEC forecasts slack capacity on PG&E's system above 20% in 2002 through 2004, falling to 17% in 2006. The difference between the CEC's forecast and PG&E's forecast is primarily due to the CEC's higher forecast of electric generation gas demand on the PG&E system. PG&E and the CEC demand forecasts show that PG&E's transmission and storage infrastructure will be adequate during the forecast period.
PG&E's Transmission System Could Experience Limited Curtailments Under Extreme Conditions.
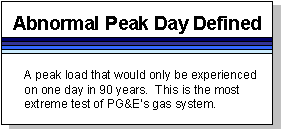
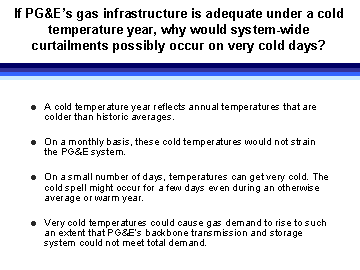 Under extremely cold weather conditions, natural gas curtailments could occur on PG&E's system even under normal hydro conditions. On a one in 90 year "abnormal peak day" (APD), all core customer demand would be served but noncore customers would be subject to curtailment.63 Limited curtailments could also occur on very cold days with a chance of occurrence of once in twenty years. The point at which curtailments would develop depends on noncore customer use of storage, which could be provided by PG&E, Wild Goose, or Lodi. Noncore storage could reduce, if not eliminate, the threat of curtailment for noncore customers. Additional Redwood Path capacity will also lessen the likelihood of curtailments.
PG&E's Local Natural Gas Transmission System
PG&E's local natural gas transmission system is designed to provide reliable service under the following two load conditions: 1) under an Abnormal Peak Day, PG&E could serve all core load, or 2) under a Cold Winter Day, PG&E could serve all customer load.64 At the CPUC's April 17, 2001 workshop on gas infrastructure, PG&E indicated that very cold weather (conditions colder than a Cold Winter Day) could result in noncore diversions and curtailments. Under weather conditions colder than a Cold Winter Day, curtailments could occur, and diversions of noncore supply could be needed to support core demand. In the CPUC's proceeding, R.01-03-023,65 PG&E stated that a local curtailment event "with brief, limited effect on noncore customers, has about a one-in-four chance of occurrence during the winter." PG&E suggested that the above design criteria could be changed, but local transmission system improvements would need to be made over several years and the costs would be significant. PG&E estimated a one-time cost of $50 million and annual expenses of $19 million to move to design criteria that would provide a one-in-twenty probability of curtailment due to local transmission constraints, rather than one-in-four probability.
Curtailments in PG&E' territory are more likely to occur on its local natural gas transmission system than on the backbone transmission system, but these curtailments would have only limited effects on a relatively small number of customers and only for a few days at most. The CPUC will evaluate whether local transmission system improvements are necessary for PG&E, and if so, and who should pay for such improvements.
There is no need for the Power Authority to fund additional infrastructure expansions in Northern California at this time. The CPUC will continue to review PG&E's ability to serve its customers and the adequacy of the PG&E gas infrastructure, and will direct when and how PG&E should construct additional capacity as necessary. This review may occur in one of several formal Commission proceedings (such as the recently filed PG&E application to extend the Gas Accord, the next PG&E BCAP, or the next PG&E GRC).
SoCalGas' System Forecast
SoCalGas' Natural Gas Transmission and Storage System
The CPUC forecasts that SoCalGas will have ample natural gas transmission and storage capacity to serve all customer demand on its system. SoCalGas forecasts (see Figure 3-7) that it will use only about 63% of average transmission capacity under normal conditions during the five-year forecast period, providing an average slack transmission capacity of 37%.66
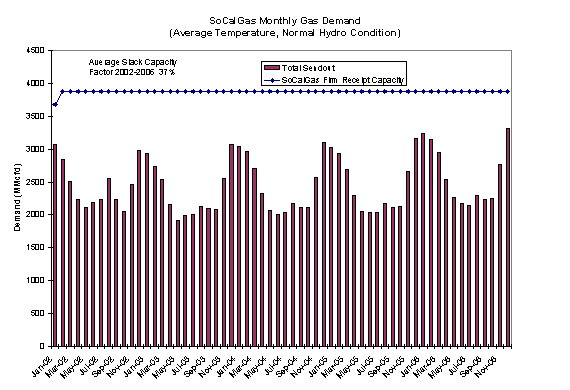 Figure 3-7: SoCalGas Natural Gas Transmission Capacity
Can Meet Demand Over the Next Five Years
Source: Southern California Gas Company, September 2001
SoCalGas Will Likely Experience Significant Slack Capacity Over the Next Five Years.
The CPUC forecasts significant slack capacity on SoCalGas system during the forecast period, because demand is expected to decline while the utility's gas transmission and storage capacity will increase. With a return to normal precipitation levels, hydroelectric generation, along with new more efficient gas-fired power plants, will reduce gas-fired power plant demand below 2000-2001 levels. By February 2002, SoCalGas' firm receipt capacity will increase by more than 10% (375 MMcfd). In addition to the expanded transmission capacity, SoCalGas will also increase capacity at its Aliso Canyon and La Goleta storage fields.
The CEC also anticipates high slack capacity for the SoCalGas system. The CEC forecasts 36% slack capacity for SoCalGas in 2002, and 35% slack capacity by 2007. The CPUC expects average slack capacity on SoCalGas' system under adverse conditions will be above 25% (as shown in Table 3-2).
SoCalGas' infrastructure is capable of serving all customer demand even on an extreme peak day.67 SoCalGas' system, including storage, is able to serve about 6,000 MMcf/d. Historical peak demand has been 5,300 MMcfd. SoCalGas' forecasted core extreme peak day demand and typical noncore winter demand are shown in Table 3-3. SoCalGas has the capacity to meet all customer demand if its noncore customers fully utilize storage capacity.
Table 3-3: SoCalGas Forecasts of Natural Gas Demand
For an Extreme Peak Day
(MMcfd)
Year |
Core EPD |
Noncore Demand |
Total Demand |
2002 |
3,137 |
2,341 |
5,478 |
2003 |
3,148 |
2,034 |
5,182 |
2004 |
3,190 |
2,002 |
5,192 |
2005 |
3,225 |
2,072 |
5,297 |
2006 |
3,388 |
Not Available |
Source: Southern California Gas Company, September 2001
No additional measures need to be taken at this time by the Power Authority to require additional natural gas system capacity in the SoCalGas service territory. SoCalGas' backbone natural gas transmission and storage capacity is adequate for the forecast period.
SoCalGas' Local Gas Transmission System
The CPUC has identified two local gas transmission points on the SoCalGas system with potential constraints. These constraints are located on the transmission pipelines located in the San Joaquin and Imperial Valleys. Expansions of these lines may be necessary to minimize bottlenecks and reduce the possibility of curtailments. The CPUC is reviewing these local transmission constraint points in Investigation (I.) 00-11-002.
SoCalGas will file a General Rate Case application toward the end of 2002 for a 2004 Test Year.68 In addition, SoCalGas will likely file another Biennial Cost Allocation Proceeding application in late 2003 or in 2004. These proceedings will give the CPUC opportunities to review again the adequacy of SoCalGas' infrastructure, and require SoCalGas to expand its system further, if necessary, with adequate lead-time to assure a high level of reliability. The CPUC will also address policy regarding SoCalGas' natural gas transmission capacity in I. 00-11-002.69
SDG&E's System Forecast
SDG&E receives all of its natural gas from SoCalGas on two pipelines, at the San Diego County line at the San Onofre and Rainbow metering stations. SDG&E has a small storage contract with SoCalGas, but the storage fields are not in the SDG&E area. Consequently, SDG&E's peak system demand must be met entirely via the natural gas transmission capacity of the San Onofre and Rainbow lines.
SDG&E experienced significant gas curtailments on its system during the winter of 2000-2001, because natural gas demand by large electric generation customers was much higher than in previous years. A significant portion of this increased power-plant demand was due to the large new gas-fired power plant that came online in Rosarito Mexico in the summer of 2000.
In May 2000, SoCalGas reduced the likelihood of future curtailments in its territory by adding 70 MMcfd of capacity to the pipeline that supplies most of the gas to the SDG&E system.
CPUC Forecasts Adequate Transmission Capacity on SDG&E's System
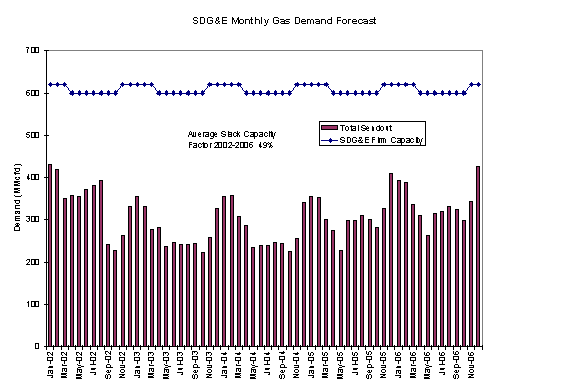
Under most scenarios, the CPUC expects the existing transmission capacity into the SDG&E system to be more than adequate to serve all average monthly demand in the SDG&E territory (see Figure 3-8). Similarly, the latest CEC annual forecasts of gas demand indicate ample natural gas transmission capacity on the SDG&E system. The CEC forecasts indicate slack capacity of about 50% during the forecast period.70
Figure 3-8: SDG&E Transmission Capacity Is Able to Meet
Forecast Average Monthly Demand
 Source: SDG&E, October 2001
The major uncertainties related to SDG&E's ability to serve its customers are: 1) whether the North Baja pipeline will actually be completed, 2) how much SDG&E gas load that project will serve, 3) how much new electric generation facilities will impact the operation of electric generators in the SDG&E area, and 4) whether adverse weather conditions will occur, such as dry hydro conditions or very cold weather.
Curtailments could still occur on the SDG&E system in the winter of 2001-2002 on very cold days. After the winter of 2001-2002, assuming that the North Baja pipeline is constructed and completed by November 2002, the probability of noncore customer curtailments falls to about once in twenty to 35 years.
In Investigation (I.) 00-11-002, the CPUC is reviewing the SDG&E system to determine if any additions are needed. This evaluation of potential SDG&E transmission capacity additions will take into account the timetable for proposed additions, the costs, and future natural gas demand. Based on the evidence, the CPUC will direct SDG&E to take reasonable measures to enhance its transmission infrastructure. If hydro conditions return to normal, and the North Baja pipeline is built and serves some of the demand in the SDG&E area, the likelihood of system-wide gas curtailments will be further reduced or eliminated. At this time, the North Baja project construction schedule is generally on track.71
CHAPTER 4
CONCLUSIONS AND RECOMMENDATIONS
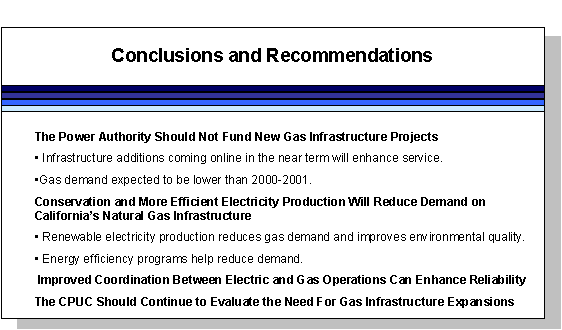
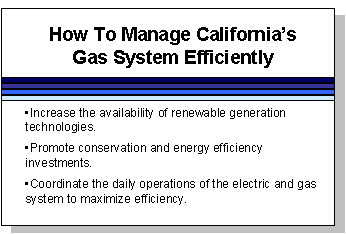
A. Conservation, Renewable Energy, and More Efficient Production of Electricity Will Reduce Demand On California's Natural Gas Infrastructure
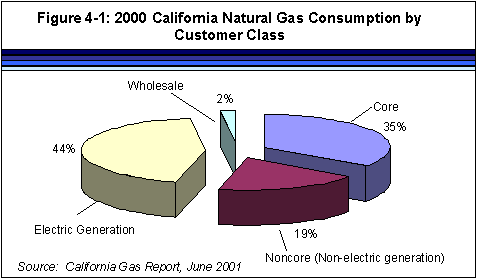
 Gas-fired power plants use more natural gas than any other customer group, as shown in Figure 4-1. Any efforts to reduce electric demand or improve the efficiency of the gas-fired plants will reduce gas demand. Minimizing gas demand reduces costs for consumer by reducing the need for expensive improvements to the system and keeping the price for gas low.
Renewable Electric Generation Technologies Reduce Demand and Improve Environmental Quality.
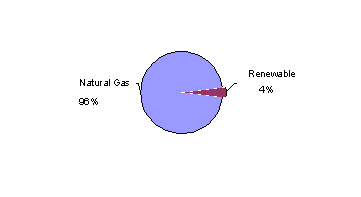
Over 95% of the new power plants being proposed in California are gas-fired power plants as shown in Figure 4-2. Initiatives that promote the construction of renewable energy projects help keep gas demand and prices down and provide environmental benefits. Every 1,000 MW of new renewable generation installed instead of gas-fired plants would save approximately 120 million cubic feet of gas per day72 and avoid the pollution that would be produced by the use of that gas.
Figure 4-2: Planned California Generation 2001-2007
New Capacity by Fuel Source
![]()
The CPUC is considering the role of renewable energy in meeting California's future electricity needs in its current rulemaking regarding utility procurement (R. 01-11-024). Other initiatives to promote renewable energy include: increased tax credits at the state and federal level, requests for bids for renewable energy by the California Power Authority, and a recently passed proposal in San Francisco to finance 50 MW of renewable/energy conservation projects (Proposition H).
Role of Energy Efficiency in Reducing Gas Demand
Increased energy efficiency, coupled with voluntary efforts to reduce energy usage during times of peak demand, reduces natural gas usage. In 2000, the CPUC funded energy efficiency measures that saved close to 1 million megawatt-hours of energy - enough energy to power a city the size of San Jose for a year. Eliminating this electricity usage kept inefficient gas-fired power plants idle, which avoided the consumption of an estimated 32 million cubic feet of gas per day. CPUC funded energy efficiency programs that directly focus on gas usage provided an additional saving of 4 million cubic feet day.
Voluntary efforts to reduce electricity usage, such as the Governor's "Flex-your-Power" and "20/20" programs, have been very successful in reducing gas usage by curbing electric demand. Developing voluntary programs that urge customers to reduce natural gas usage during periods of peak usage may also be an effective way to maintain the reliability of the gas system.
B. Improved Coordination Between Electric and Gas Operations Can Enhance Gas System Reliability
Increased coordination between electric dispatch (primarily by the ISO) and utility gas operations could improve reliability. For example, when gas supplies are tight, the ISO could seek to increase hydroelectric generation or out-of-state power purchases to reduce the gas demand of the gas-fired power plants. Similarly, the ISO could help avoid local gas constraints by taking into consideration the condition of the gas transmission system serving the gas-fired plants that it dispatches.
C. The Power Authority Should not Fund New Gas Infrastructure Projects
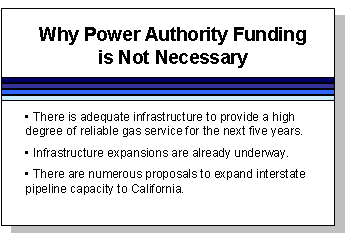 The CPUC expects sufficient infrastructure to provide a high degree of reliability for gas consumers during the next five years. This infrastructure provides California with ample access to several sources of competitively priced gas supply. The CPUC forecasts that the addition of new and efficient gas-fired power plants and a return to normal hydroelectric availability will work together to reduce gas demand.
Infrastructure Additions Coming Online in the Near Term Will Enhance Service.
In the next few years, California's transmission and storage systems will be improved with the addition of new capacity. In 2002, several new transmission additions will be made to the PG&E and SoCalGas systems. These expansions will add 200 MMcfd of transmission capacity to the PG&E system, and at least 375 MMcfd of transmission capacity to the SoCalGas system.
California will have increased gas storage over the next five years. In December 2001, the new Lodi gas storage facility will begin operations; in 2002, SoCalGas will be expanding its storage capacity. In addition, Wild Goose Storage and PG&E are both working on plans to expand their storage capacities.
D. The CPUC Should Continue to Evaluate the Need For Gas Infrastructure Expansions
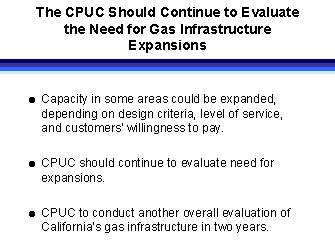 The CPUC will continue to keep close watch on California's gas infrastructure to ensure reliable service at reasonable rates. In pursuing this mission, the CPUC will approve prudent investments and determine how consumers pay for those investments. In two years' time, the Commission shall conduct an overall evaluation of California's gas infrastructure to ensure that the State's natural gas needs will be met.
Capacity in areas subject to potential curtailments could be expanded, but any additions would have to be evaluated against the costs of the project. The California gas utility systems are designed to provide service to all core customers under extreme weather conditions, and to provide a high degree of reliability to noncore customers under adverse conditions. The CPUC has found that there is the possibility of limited curtailments under adverse conditions. Expanding the infrastructure to serve all customers (core and noncore) under these limited conditions would result in higher rates for all customers. These costs would have to be carefully considered by the Commission before such expansion projects are approved.
The CPUC allows noncore customers to make their own calculation of whether or not enhanced reliability is worth the additional costs. Traditionally, noncore customers have preferred low rates in exchange for the very infrequent chance of a short curtailment.
GLOSSARY
Abnormal Peak Day - On Pacific Gas and Electric's system, an abnormal peak day is defined as a system-weighted mean temperature of 29_ Fahrenheit, which has a probability of occurring once in 90 years. On SoCalGas' system, an extreme peak day is defined as a day when the average system-wide temperature is 38_ Fahrenheit. This has a probability of occurring once in 35 years.
Average temperature year - A forecast year based on long-term average recorded temperatures, or "heating degree days."
Biennial Cost Allocation Proceeding (BCAP) - A natural gas utility rate-setting proceeding generally held every two years to allocate the transportation revenue requirement adopted in the utility's General Rate Case (GRC) among gas customer classes.
BCF - Billion Cubic Feet - a volumetric measurement of gas. One Bcf is approximately equal to 1.027 trillion Btu.
Bcfd - Billion cubic feet per day
BTU - British Thermal Unit - A unit of measurement equal to the amount of heat energy required to raise the temperature of one pound of water one degree Fahrenheit. This unit is commonly used to measure the quantity of heat available from complete combustion of natural gas.
Bypass - Natural gas service provided directly by a FERC-regulated interstate pipeline or by a California producer without using the facilities of the CPUC-regulated utilities.
CEC - California Energy Commission
Cold temperature year - A forecast year based on historically cold weather, e.g. the temperatures recorded over the last 40 years.
Core customer - Customers with average usage of less than 20,800 therms per month. Most core customers are residential and small commercial customers.
CPUC - California Public Utilities Commission
Cubic Foot of Gas - Volume of natural gas that, at a temperature of 60 degrees Fahrenheit and an absolute pressure of 14.73 pounds per inch (psi), occupies one cubic foot.
Curtailment - Partial or complete temporary suspension of gas deliveries to a customer or customers.
Dth - Decatherm - Ten therms, a common unit used in burner-tip prices ($/Dth). One therm equals 100,000 Btus; a decatherm is equal to a million Btus.
Degree Day (Heating) - A measure of how much actual temperatures fall below a standard reference temperature. For SoCalGas and SDG&E, the reference temperature is 65_ F; for PG&E, the reference temperature is 60_ F. Degree-days provide a basis for computing how much natural gas and electricity are needed for space heating.
Dry hydro condition - A "dry hydro" condition in this report is defined as a level of hydroelectric generation that is exceeded in 95% of years in the Western Systems Coordinating Council (WSCC).
FERC - Federal Energy Regulatory Commission
Firm capacity - When referring to interstate pipeline, backbone transmission, or storage, firm capacity is capacity that is available under virtually all operating conditions 365 days a year.
General Rate Case (GRC) - A major regulatory proceeding for California utilities, during which regulators examine in depth a utility's costs and operations as part of the overall process to establish a utility's revenue requirement.
Heat rate - A measure of the amount of thermal energy needed to generate a given amount of electric energy.
Hot temperature year - A forecast year based on historically warm weather.
Interruptible capacity - Interstate pipeline, backbone transmission or storage capacity, which may be available from time to time, but cannot be assured under all operating conditions.
MMCF - One million cubic feet of gas.
MMBtu - One million British Thermal Units.
MMcfd - One million cubic feet of gas per day.
MW -Megawatt. A basic unit of measure for electric power. One megawatt is sufficient to meet the electric demand of about 1,000 households.
Noncore customers - Customers who use more than 20,800 therms per month. Noncore customers typically are large commercial, industrial, cogeneration, wholesale, and electric generation customers.
Open season - Designated time period in which potential customers for a proposed transmission or storage project must submit their service elections for capacity to the interstate pipeline, utility, or storage provider. For the CPUC-regulated utilities, noncore customers that do not elect firm capacity during an open season may receive default service, or they may continue to receive service based on prior elections depending upon tariff provisions and available capacity.
Peak Day - the day during which the highest load occurred during a specified period.
Receipt Capacity - The amount of backbone transmission capacity a utility has to receive gas at each connection with another pipeline system.
Slack capacity - the amount of unused transmission capacity divided by the total firm capacity.
Therm - Unit of heat equal to 100,000 British thermal units; approximately 100 cubic feet.
WSCC - Western Systems Coordinating Council
27 SDG&E's reserve margin is the difference between the maximum operating capacity and the amount of capacity SDG&E offers to core customers and firm noncore customers. This reserve margin takes into account potential scenarios that could limit gas deliveries. For example, 45 MMcfd is the reduction in system capacity if a 3000 HP compressor were to go down at the Moreno Compressor Station. Capacity may be reduced by other unforeseen circumstances; the reserve margin is a proxy for those situations.
28 In addition to the 45 MMcfd reserve margin, SDG&E has up to 64 MMcfd in linepack capacity that can be used to balance sudden increases in demand or shortage of flowing supply. Linepack provides temporary daily storage of flowing supply within the pipeline. 29 Wild Goose Storage Inc. is a wholly owned subsidiary of Alberta Energy Company Ltd., Canada's largest natural gas producer. 30 Lodi Gas Storage, based in Houston, is a subsidiary of Western Hub Properties, which formed Haddington Ventures in 1998 to develop natural gas facilities. 31 On PG&E's system, an abnormal peak day is defined as a system-weighted mean temperature of 29_ Fahrenheit, which has a probability of occurring once in 90 years. 32 On SoCalGas' system, an extreme peak day is defined as a day when the average system-wide temperature is 38_ Fahrenheit. This has a probability of occurring once in 35 years. 33 See D.90-02-016. 34 These expansions include: the Kramer Junction expansion of 200 MMcfd, Wheeler Ridge expansion of 85 MMcfd, North Needles expansion of 50 MMcfd, and Line 85 (California production) of 40 MMcfd. 35 The Kern River High Desert in-state expansion from Kramer Junction to Victorville for 282 MMcfd is not included in the table. This expansion planned for 2002 does not add capacity to California. 36 In addition to the above expansions, the North Baja expansion of 500 MMcfd is expected to come online in July 2002. This project will not add interstate pipeline capacity to California, but it could potentially serve the proposed Blythe power plant and provide deliveries to the SDG&E service territory. 37 Los Angeles Times, October 5, 2001, "Sempra Plans Major Energy Project in Baja." 38 B.B. InterCapital, formed in 1999, has offices in La Paz, Bolivia and Boston, Massachusetts. 39 A "Dth" stands for a "decatherm" or ten therms of gas. A Dth is equivalent to a million BTUs of gas energy. One thousand Dth, or an MDth, is roughly the energy content of a million cubic feet (MMcf) of gas volume. 40 "California Natural Gas Market: Interstate Pipeline Dominance, Exorbitant Prices, and Federal Regulatory Actions", California Assembly Subcommittee on Energy Oversight, May 2001, pg. 15. 41 California Gas Report, 2001. 42 A proposed decision has been issued in R.01-03-023. 43 The Utility Reform Network's August 21, 2001 comments on the CEC's draft "Natural Gas Infrastructure Report" also express disagreement with the view that the price increases during the winter of 2000-2001 were primarily due to inadequate gas infrastructure.44 An "average temperature year" is based on long-term, average recorded temperatures, or "heating degree days." A "dry hydro" condition in this report is defined as a low level of hydroelectric generation that is experienced only once every 20 years in the Western Systems Coordinating Council (WSCC).
45 The displacement of electricity produced by older generation units may not be a perfectly efficient process, given that the ISO does not dispatch power plants based on efficiency, and given that the Department of Water Resources has power contracts with specific plants. Nevertheless, this displacement is expected to result in a significant reduction in gas demand. In Chapter 4, the CPUC recommends that there should be improved coordination between electric and gas operations in the state to improve the efficiency of both operations. 46 For example, see the California Energy Commission's "Natural Gas Infrastructure Issues," September 2001 and Southern California Gas Company's Application 01-09-024, September 2001. 47 Southern California Gas Company, Application 01-09-024, Attachment I, pg. 11, September 2001. 48 The "heat rate" of a gas-fired power plant is the amount of natural gas energy needed to generate a given amount of electricity. Thus, power plants with lower heat rates are more efficient than plants with higher heat rates. 49 Proposals have been made for new interstate pipelines within Northern California, but these proposals remain speculative. Absent these pipelines, PG&E would serve new power plants built in Northern California. 50 On July 13, 2001, the CPUC filed a joint complaint at the FERC against El Paso regarding this very issue. El Paso customers east of California have been receiving their full gas requirements, while California customers have not been receiving their contract demand amounts, even though California customers pay fixed reservation charges for the use of El Paso firm pipeline capacity. 51 "U.S. Natural Gas Markets," EIA, May 2001. 52 "An Assessment of Recent Natural Gas Market Trends," DOE, October 17, 2001. 53 "Slack capacity" is the amount of unused firm transmission capacity, typically on an annual basis divided by the amount of firm transmission capacity. The figures shown in Table 3-2 are the averages of the slack capacity figures for 2002-2006 54 SoCalGas submitted these figures subject to confidentiality restrictions. 55 For this analysis, the CPUC calculates statewide delivery capacity to be 7,790 MMcfd for January through October 2002, and 7,990 after 2002. In this report, we assume for the forecast period that California-produced bypass gas deliveries will continue at the same level as in 2000, i.e. 552 MMcfd. 56 The proposed Kern River expansion is not included in the CPUC's calculation of statewide transmission capacity in Figures 3-4 and 3-5. 57 This forecast also closely agrees with the gas demand forecast recently shown by the CEC in their report "California Energy Outlook: Electricity and Natural Gas Trends Report", dated September 7, 2001. 58 CEC gas demand forecasts for the PG&E system are higher than the forecasts prepared by PG&E, but CEC forecasts for the SoCalGas system are about the same as the demand forecasts prepared by SoCalGas. 59 For this analysis, the CPUC calculate PG&E firm capacity to be 3,143 MMcfd through October 2206, and 3,293 MMcfd after October 2002. 60 The CPUC has assumed for the purpose of this report that the proposed Redwood Path expansion will be in service at full capacity by the beginning of the 2002-2003 winter heating season, i.e. by November 1, 2002. This expansion adds 200 MMcfd to the PG&E backbone natural gas transmission system, an increase of 6.4%. 61 PG&E firm "intrastate" backbone transmission capacity refers to the amount of transmission capacity available to take away gas from interstate pipelines connected to PG&E on a very reliable basis. It is sometimes also referred to as the firm "takeaway" capacity, or the firm "receipt point" capacity. 62 CEC forecasts under hot or cold temperatures or dry hydro conditions are not available at this time. 63 PG&E provided specific demand information on very cold days to the CPUC, but requested that this information remain confidential, under the provisions of California Public Utilities Code Section 583. 64 For PG&E, an Annual Peak Day (APD) occurs when the average system temperature hits 29 degrees or lower. This condition is only expected once every 90 years. Under a Cold Winter Day, average system temperature hits 38 degrees. This condition is expected to occur about once every four years. 65 In Order Instituting Rulemaking (R.) 01-03-023, the Commission is reviewing the noncore customer curtailment priorities for the PG&E and SoCalGas service areas. 66 For this analysis, the CPUC calculates SoCalGas' firm transmission capacity to be 3,675 MMcfd in January 2002, and 3,875 MMcfd thereafter. 67 On SoCalGas' system, an extreme peak day is defined as a day when average system-wide temperature is 38 degrees. This has a probability of occurrence of once in every 35 years. 68 On October 10, 2001, the Commission issued D.01-10-030, granting SoCalGas and SDG&E's request to defer their General Rate Case (GRC) for one year. The "test year" for the GRC will be 2004, with the SoCalGas and SDG&E GRC application expected in late 2002. 69 In Order Instituting Investigation (I.) 00-11-002, the CPUC is reviewing the transmission capacity of the SoCalGas and SDG&E systems, and is considering design criteria for transmission capacity additions to those systems. 70 For this analysis, the CPUC uses SDG&E firm transmission capacity of 620 MMcfd in the winter and 600 MMcfd in the summer. 71 On May 16, 2001, the FERC approved the non-environmental portions of North Baja Pipeline's application to build the 80-mile U.S. portion of the pipeline. Approval of the environmental portion is pending. In December 2000, Mexico's Comision Reguladora de Energia granted a permit to build the Mexican leg of the pipeline. 72 Assuming the new renewable power plant displaces a new base load (70% capacity factor) gas fired power plant operating at 7,000 Btu/kWh.