IV. Federal Measures of Service Quality - ARMIS and MCOT Data
There are two major sets of Federal measures of service quality. The first set, known as the ARMIS measures, has been in place since 1987. More recently, as a condition of large telecommunications mergers, the FCC adopted additional service quality measures, known as MCOT measures. We now turn our attention to these measures of service quality.
A. ARMIS Measures
The FCC requires the carriers to submit reports on several aspects of service quality, and the results for relevant years appear in the record of this proceeding.60 The Automated Reporting Management Information System (ARMIS) data stem from FCC Common Carrier Docket No. 87-313, which implemented service quality reporting requirements for local exchange carriers such as Pacific and Verizon. In 1991, the FCC added specific reports to collect service quality and network infrastructure information.
The ARMIS 43-05 report contains service quality performance measures which track, among other things, whether Pacific or Verizon meet their installation commitments for residential and business customers, trouble reports and repair intervals (e.g., both initial and repeat trouble reports, and the time required to dispatch and complete repairs in response to trouble reports), and switch downtime incidents.61 While there are no performance standards associated with these reports, they track very important service quality measures.
The ARMIS 43-06 report tracks customer perceptions of Pacific's and Verizon's service quality and will be discussed in the Section entitled "Survey Data and Customer Satisfaction".
B. Accuracy of Data
1. General Issues with Pacific's Data
A key issue in the proceeding concerned the accuracy of the service quality data that Pacific reports to the FCC as part of its ARMIS reporting obligations. ORA claims that even where Pacific reports positive ARMIS results, the results are unreliable because of errors in the underlying data. Initially, ORA claimed Pacific provided ORA inaccurate installation data for the period 1998-2001. It later changed that assertion to limit the period of claimed inaccuracy to 1998-99, and we limit consideration of the accuracy of Pacific's data to this time period.62
ORA relied principally on the work of Linette Young in this area. Ms. Young downloaded Pacific's raw data into a database format, and then compared it to Pacific's summary data as reported in ARMIS. Where there were inconsistencies across these two sets of data, ORA assumed the ARMIS reports were inaccurate. ORA made many corrections to the data over time as Pacific pointed out problems.
Ultimately, it became apparent that the data mismatches that ORA found were due not to Pacific's misrepresentations, but rather to differences between the raw data ORA examined and the data Pacific uses to report to regulators. For example, Pacific modifies its raw data to remove certain types of telephone services that the ARMIS regulatory requirements do not include. We find, therefore, that ORA did not establish that Pacific misreports its installation service results. Therefore, we deny ORA's recommendation that we conduct an audit of Pacific's historic installation data to determine the extent of data error and its subsequent impact on reported service quality results during the NRF period. We do not agree that such an audit is appropriate, since we conclude that ORA did not show that Pacific's installation data are inaccurate.63
However, this incident illustrates the difficulties that arise when interactions between a utility and its regulators become needlessly adversarial. Pacific should have been far more helpful to ORA in pointing out problems with Pacific's data up front. Pacific knew that ORA had requested raw data to allow it to test Pacific's results.64 ORA, on the other hand, could have simply asked Pacific why the raw data did not match the ARMIS data. Instead, ORA conducted its analysis without any collegial interaction with Pacific, and Pacific responded by pointing out flaws after receiving ORA's testimony. This approach to regulation wastes Commission time and results in regulatory drama, but little more. Most importantly, it hinders the development of a clear evidentiary record.
As it was, ORA had to change its analysis each time Pacific explained problems in translating its raw data to reports made for regulatory purposes. In the end, the proceeding could have been much more productive had all such translation errors been resolved beforehand.
We next address ORA's specific allegations regarding the accuracy of Pacific's data.
2. Pacific's Data Concerning Installation Orders Require Clarification
ORA claims its analysis shows that Pacific closes installation orders before they are complete. This would have the effect of systematically understating installation intervals in regulatory reports. ORA bases its conclusion on its examination of four informal complaints from residential customers who ordered multiple telephone lines at the same time. These lines were to be installed at the same address on the same commitment date. Ms. Young testified that when it was discovered there were not sufficient facilities available to install both lines, "apparently what occurred was Pacific installed one line, closed the order and then reopened or initiated a second order for the second line." ORA is speculating on this point in its use of the term "apparently what occurred." Pacific pointed out that ORA was speculating, and also stated "lack of facilities for four customers does not constitute a widespread problem."
We agree that there is not enough evidence in the record for us to conclude that Pacific is closing installation orders prematurely. Because the record is unclear on this issue, we order Pacific to file and serve data in the form of a compliance filing in this docket that affirmatively addresses this point within 30 days of the effective date of this decision. Pacific shall answer the following questions in its submission:
a. Has Pacific at any time during the period 1990-2002 closed installation orders containing multiple lines to be installed on the same order after a portion of - but not all - the lines were installed?
b. If the answer to the previous question is yes, produce an annual summary of the number of such orders.
c. If Pacific reports that any multi-line order was closed before all lines associated with that order were installed, explain in detail how Pacific accounts for such orders when calculating its installation intervals for purposes of any regulatory reporting requirements.
3. Allegation that Pacific's Reports Contain Erroneous Duplicate Records Has No Factual Basis
ORA also argued that the presence of "duplicate" records among the data Pacific provided it indicates there are errors in Pacific's data. However, ORA states in this regard that "ORA does not claim that all duplicate records are erroneous records,"65 and indeed later appears to concede that "the duplicate records should be included" in Pacific's calculation of its installation intervals.66 ORA also confusingly asserts that, [t]he "erroneous duplicate records" that Pacific refers to are the same anomalous records (orders for basic service that do not contain commitment dates), which Pacific has previously claimed are not erroneous records. After having argued for the inclusion of the duplicate and anomalous records, Pacific cannot now claim that these `erroneous duplicate records' are erroneous."67
It appears from its statement that ORA no longer claims there is a problem with Pacific's data due to the presence of duplicate records, and we find that this allegation has no factual basis
4. Allegation that Pacific's Reports Contain Erroneous "Anomalous Records" Has No Factual Basis
ORA also claims there is a problem with "anomalous records" - records without "commit dates" (dates on which Pacific committed it would complete an installation). ORA's witness believed these records were suspicious based on her belief that "no order for services could flow through Pacific's systems without a commitment date." She claims Pacific told her of this restriction several times, but submitted no written evidence in the record of such a representation by Pacific. Indeed, the evidence is to the contrary. As Pacific points out, it is appropriate that certain orders - related to "supersedures" where a new resident at an address takes over the phone service of the existing customer - not contain "commit dates."
5. Verizon's Data Are Accurate
ORA raised similar issues concerning Verizon's data. ORA asserts that Verizon's data includes duplicate data, that data fails to track across different data bases, that data on installation intervals is unreliable, that the data on the number of commitments met is in error, and that Verizon closes service orders too soon.
Verizon successfully responded to each of these challenges.
We find that ORA's challenges to Verizon's data almost identical to their challenges to Pacific's and suffer from the same deficiencies. We reject ORA's challenges to Verizon's data for essentially the same reasons.
Although our experience with regulation makes us sympathetic to the complexities of data reporting and analysis, we find that many of the allegations arise from simple misinterpretations by ORA of the data presented to ORA by Verizon. For example, ORA alleged that any installation order that was reopened within 60 days represented a premature closing of the service record by Verizon. In response, Verizon noted that this is a common occurrence and explained by a variety of phenomena, and Verizon explained each of the examples used by ORA to illustrate its allegation. Thus, ORA's allegation of misreporting of data was shown to have no validity.
Our purpose in an administrative proceeding such as this is to develop an evidentiary record that supports reasonable decisionmaking. As we noted above, professional collaboration between regulator and the regulated on data matters, in particular, serves the public interest better than adversarial interactions.
C. Summary Table of ARMIS 43-05 Measures
For the measures reported in ARMIS 43-05, we examined Pacific 68and Verizon's69 performance over the years, and compared it with each other and with the performance of the reference group.70 The major results of our statistical analysis are reported in the tables that follow.71 Although we present the analysis at this point as a reference matter, we will not discuss the results in this section. Subsequently, we describe each measure and we graph each carrier's performance in each of these measures.72 In these subsequent sections, we will comment on each utility's performance and indicate whether any improving or deteriorating trend is observed and discuss the results of our statistical analysis at that point. The reader unfamiliar with statistical analysis may jump over these tables to our subsequent discussion.
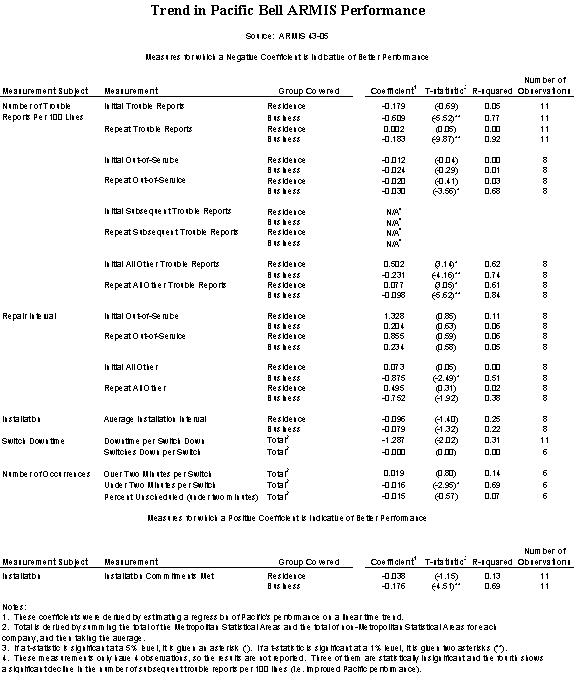
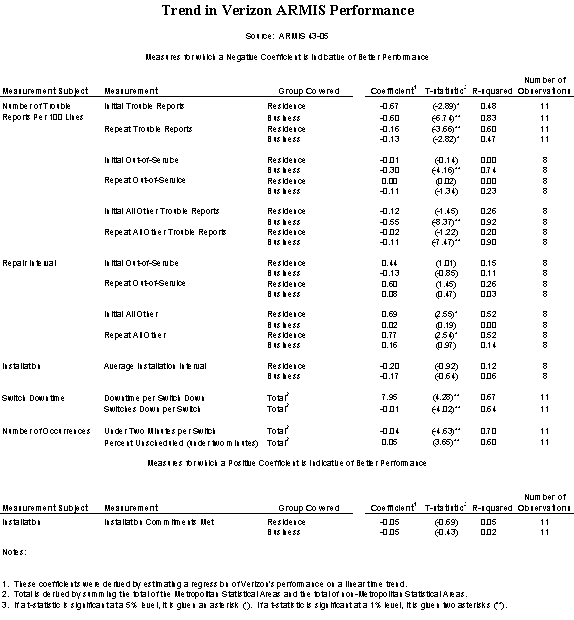
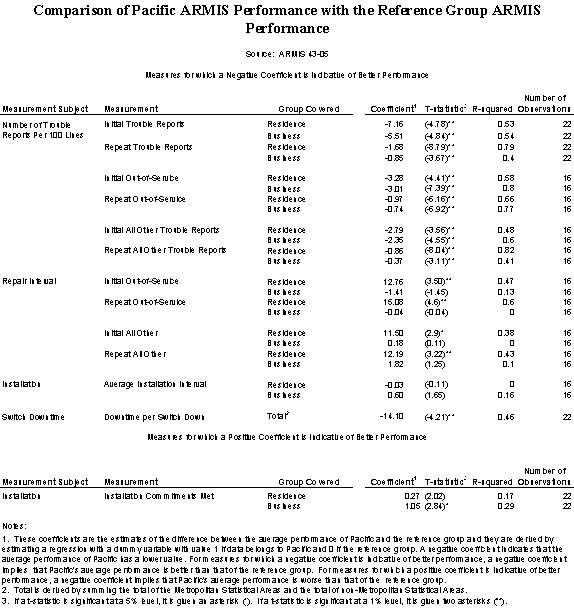
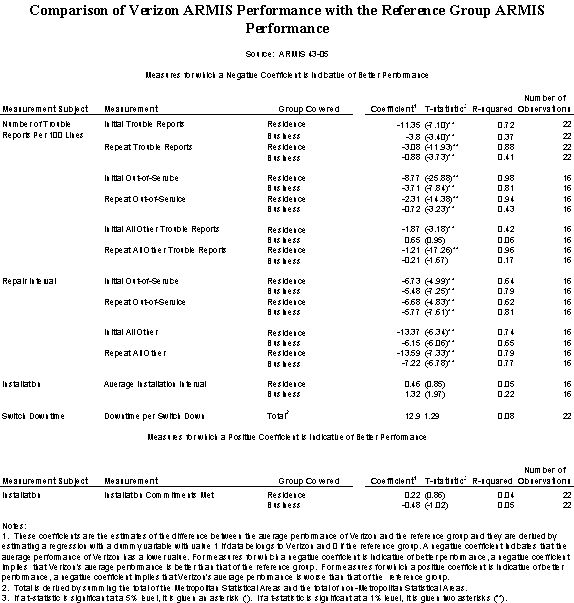
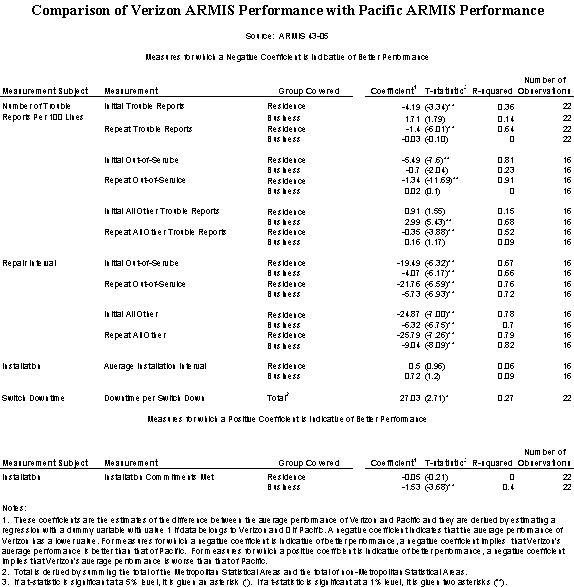
1. The Number of Initial Trouble Reports per 100 Lines: Pacific - Residential and Business Significantly Better than Reference Group, Business Significantly Improving Trend but No Trend for Residential; Verizon - Business and Residential Significantly Better than Reference Group and Trends Improving Significantly
The first ARMIS measure we examine is the number of initial trouble reports for a utility normalized on the number of access lines in the utility. These reports are related to problems that have not been reported within the thirty-day period. The normalization based on the number of access lines allows comparison among carriers and over time.
For residential lines, a visual inspection of the graph below shows that Pacific's performance exceeds that of the reference group and suggests that it is improving over time. However, the statistical analysis indicates that Pacific's performance on this measure of residential service does not demonstrate a statistically significant upward or downward trend.73 Pacific's average residential performance, however, is significantly better than the average of the reference group.74
For business lines, we observe a statistically significant downward trend, which is an indicator of improving performance.75 Pacific's average business performance is significantly better than the average of the reference group.76
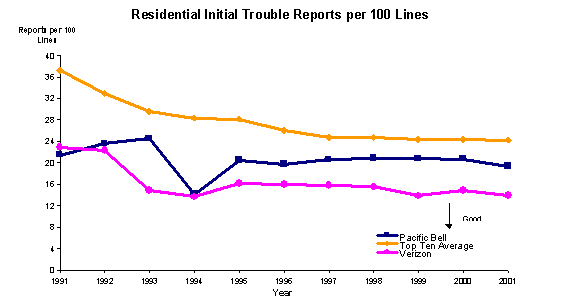
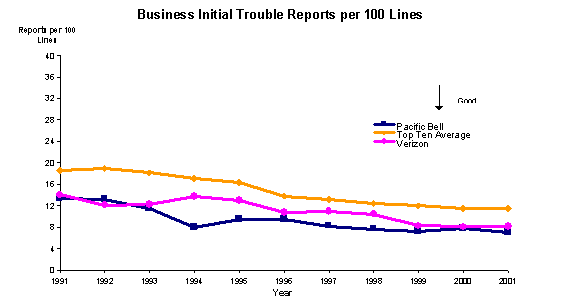
Turning now to Verizon, we find that for both residential and business lines, Verizon has demonstrated an improving trend and its average performance is significantly better than the average of the reference group.77 The average performance of Verizon is also better than Pacific for residential lines, but for business lines, the difference between the average performances is not statistically significant.78
In summary, both Pacific and Verizon show good performance on this measure of service quality, initial trouble reports per 100 access lines for both residential and business customers. Verizon exhibits a better record than Pacific.
2. The Number of Repeat Trouble Reports per 100 Lines : Pacific - Residential and Business Significantly Better Than Reference Group, Business Significantly Improving Trend but No Significant Trend for Residential; Verizon - Residential and Business Significantly Better Than Reference Group, Trends for Both Improving Significantly
The number of repeat trouble reports per 100 lines are the reports concerning service quality that are received within thirty days after the resolution of an initial trouble report on the same line. This is a measure of the extent to which a utility has successfully resolved a trouble report on the first try.
A visual inspection of the graph below suggests that Pacific's number of repeat trouble reports per 100 residential lines has not varied much over the years under review. Statistical analysis confirms our visual impression, and does not demonstrate a statistically significant upward or downward trend for residential lines.79
A visual inspection of the next graph shows that, for business lines, Pacific's number of repeat trouble reports has improved. Statistical analysis documents this downward trend and finds it statistically significant.80 This leads us to conclude that Pacific's performance has demonstrated improvement.
Finally, we observe that on both residential and business service, Pacific's repeat trouble reports appear to fall below the reference group. Our statistical analysis indicates that difference between Pacific and the reference group's average performances is statistically significant.81 This leads us to conclude that on this measure, Pacific's performance is better than the reference group.
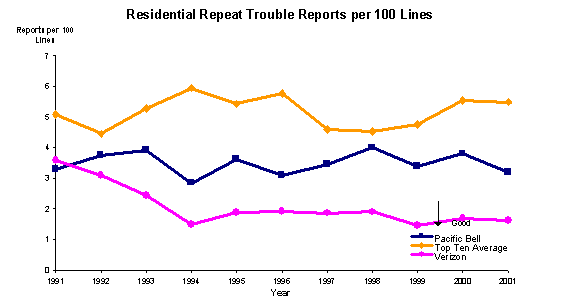
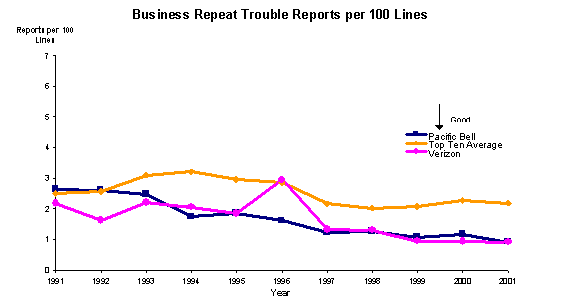
Turning now to Verizon, we find a similar story of good and improving service. A visual inspection shows that Verizon's residential repeat trouble reports is better than the reference group and show a consistent pattern of improvement. For business repeat trouble reports, our visual inspection shows that with exception of 1996, Verizon shows a record of service better than that offered in the reference group. Statistical analysis confirms our visual impression. Verizon has an improving trend for business and residential lines and its average performance is significantly different than the reference group.82 Verizon's average performance is significantly different (and better) than Pacific for only residential lines.83
In summary, both companies exhibit good service quality on these measures, significantly better than that of the reference group. On average, Verizon's performance is better than Pacific's, and this difference is statistically significant for only residential lines.
3. The Number of Initial Out-of-Service Trouble Reports per 100 Lines: Pacific - Residential and Business Significantly Better Than Reference Group and No Significant Trend for Either; Verizon - Residential and Business Significantly Better Than Reference Group, Business Trend Improving Significantly, No Significant Trend for Residential
The initial out-of-service trouble reports refer to the troubles that cause the customer to be totally without telephone service. A visual inspection of the graphs below suggests that Pacific's residential performance improved since 1997 and its business performance does not exhibit an upward or downward trend, and both appear better than the reference group. Our statistical analysis shows Pacific's performance does not exhibit a statistically significant upward or downward trend for either business or residential measures.84 Pacific's average performance has been significantly better than the average of the reference group.85
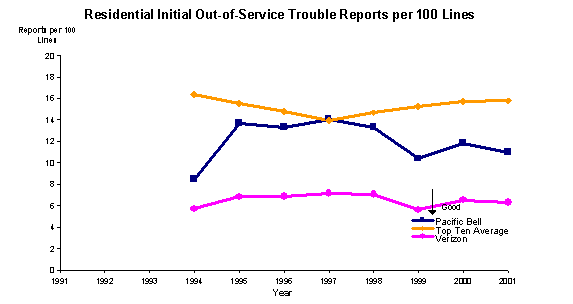
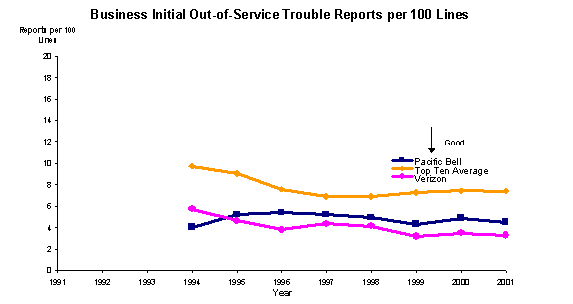
A visual inspection of the graphs above indicates that Verizon's performance is better than the reference group, and better than Pacific's for both residential and business lines. Moreover, a visual inspection suggests that for business lines, Verizon shows a record of improvement over time. A statistical analysis confirms our visual conclusions. Verizon's performance exhibits a declining trend for its business lines, which indicates an improving performance.86 Our analysis finds no statistically significant upward or downward trend in Verizon's performance for residential lines.87 Verizon's
average performance has been better than the average of the reference group.88 It also outperformed Pacific for residential lines.89
4. The Number of Repeat Out-of-Service Trouble Reports per 100 Lines: Pacific - Residential and Business Significantly Better Than Reference Group, Business Trend Improving Significantly and No Significant Trend for Residential; Verizon - Residential and Business Significantly Better Than Reference Group and No Significant Trend for Either
A visual inspection of the graphs below shows that Pacific's performance for residential lines does not exhibit a downward or upward trend, while its performance for business lines shows a slightly downward trend. Pacific's performance in both categories appear better than that of the reference group. Our statistical analysis confirms both these impressions. Pacific's performance does not demonstrate a statistically significant upward or downward trend for residential lines, but its performance exhibits improvement in business lines.90 Pacific's average performance is significantly better than the average of the reference group.91
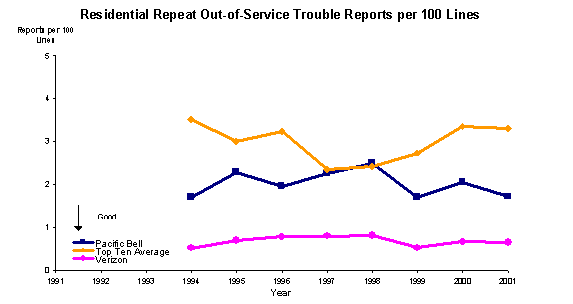
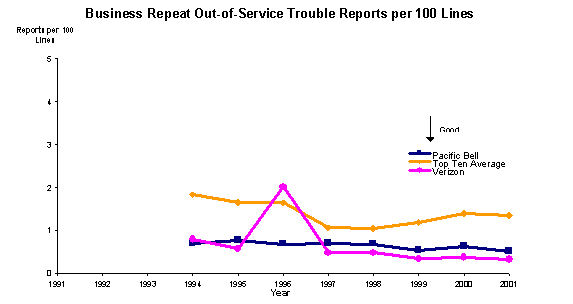
A visual inspection indicates that Verizon's performance is far better than the reference group for the residential customers and it is better than the reference group for the business customers except in 1996. Verizon's performance does not exhibit any upward or downward trend in this area.92 Verizon's average performance is statistically different than the reference group for both residential and the business lines.93 Verizon's average performance was also better than Pacific for residential lines but not for the business lines.94
In all years except one, both Pacific and Verizon fared better than the reference group. Verizon performed better than Pacific in all years except 1994 and 1996 for business lines.
5. The Number of Subsequent Initial Trouble Reports and Subsequent Repeat Trouble Reports: Insufficient Observations
Pacific reported only four observations for each of these measures and stated that the trends were not statistically significant, except for the number of subsequent trouble reports per 100 lines, i.e., Pacific's performance has improved.95Verizon had also only four observations; therefore we did not check for the statistical significance of the trend.
6. The Number of Initial All Other Trouble Reports per 100 Lines: Pacific - Residential and Business Significantly Better Than Reference Group, Business Trend Improving Significantly, but Residential Trend Worsening Verizon - Residential Significantly Better Than Reference Group, Business Indistinguishable From Reference Group, Business Trend Improving Significantly but No Significant Trend for Residential
These reports refer to the complaints concerning static, interrupted calls, and etc. For residential lines, a visual inspection of the graphs below shows that Pacific's performance is deteriorating while for business lines it is improving. Pacific has been performing better than the reference group for business lines, but for residential lines it performed worse than the reference group in 1999 and 2000. Our statistical analysis confirms these results and shows that Pacific's performance exhibits an upward trend in the number of initial all other trouble reports for residential lines and a downward trend for business lines.96 Pacific's average performance, however, is significantly better than that of the reference group.97
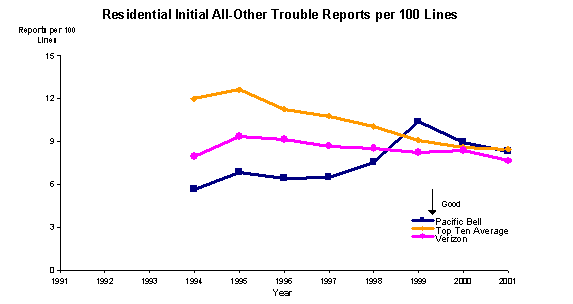
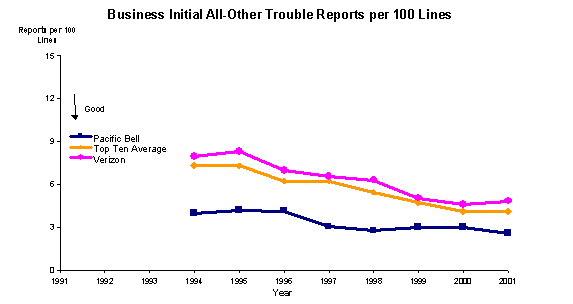
Our visual inspection indicates that Verizon has performed better than the reference group for residential lines but its performance was worse than the reference group for business lines. Verizon's performance for the residential lines did not exhibit any upward or downward trend, but its performance for business lines shows improvement.98 Its performance for residential lines is statistically better than the reference group for the residential lines, but we did not observe any statistically significant difference for the business lines.99 Verizon's average performance is not significantly different than Pacific for residential lines, but for business lines we observe a significant difference, i.e., Pacific's performance is better than Verizon's. 100
In summary, for residential lines, Verizon performed better than the reference group and Pacific performed better than the reference group until 1999. For business lines, Pacific performed better than both the reference group and Verizon, while Verizon failed to match the performance of the reference group.
7. The Number of Repeat All Other Trouble Reports per 100 Lines: Pacific - Residential and Business Significantly Better Than Reference Group, Business Trend Improving Significantly, but Residential Worsening; Verizon - Residential Significantly Better Than Reference Group but Business Indistinguishable From Reference Group, Business Trend Improving Significantly but No Significant Trend for Residential
We observe that Pacific's performance is deteriorating for residential lines and improving for business lines. The statistical analysis confirms that Pacific's performance exhibits an upward trend in the number of repeat all other trouble reports for residential lines and a downward trend for business lines.101 Yet, Pacific's average performance is significantly better than the average of the reference group for both residential and business measures.102
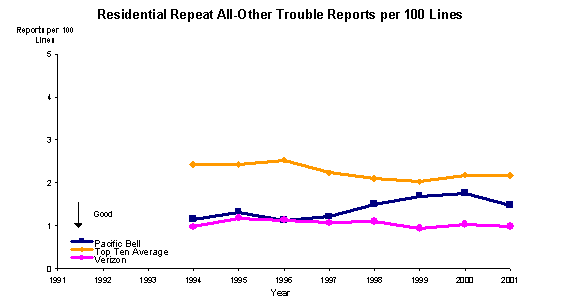
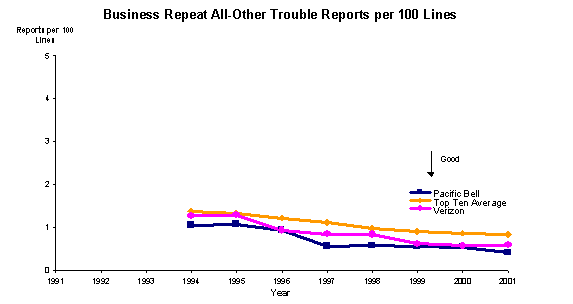
Verizon's performance did not exhibit any upward or downward trend for residential lines, but showed improvement for business lines.103 Verizon's average performance is significantly better than the reference group for residential lines, but not for the business lines.104 Verizon's average performance is better than Pacific for residential line but not for the business lines.105
8. Initial Out of Service Repair Interval (in hours): Pacific - Residential Significantly Below Reference Group and Business Indistinguishable From Reference Group, No Significant Trends for Either; Verizon - Residential and Business Significantly Better Than Reference Group, No Significant Trends for Either
On the initial out of service repair interval, Pacific's record is far different than the one developed on other measures, and it has been an area of recent Commission investigations.
In D.01-12-021, the Commission noted that Pacific's "average initial repair interval for residential customers increased 45 percent between 1996 and 2000" (with its residential repeat trouble reports per 100 lines peaking in 1998106) and that in "every year since 1996, Pacific's mean time to restore service to residential customers [was] higher than the 1996 base year."107 The Commission found "a sharp decline in service quality of nearly 50% over a mere four years coupled with Pacific's knowledge thereof and its lack of an attempt to remedy the deterioration."108 We concluded that, "The Commission cannot find that SBC Pacific's service quality is excellent when the initial out-of-service repair intervals for residential customers has (sic) increased 45% since 1996."109
Pacific's results improved beginning in 2001,110 with the exception of November 2002.111 Furthermore, in D.01-12-021, the Commission instituted a system of automatic penalties if Pacific's repair times failed to meet standards established by that decision. Pacific's record on this matter appears to illustrate the basic business school platitude that one gets what one measures. Indeed, we have so opined in other contexts: "Pacific Bell has exhibited a pattern of regulatory compliance during periods of special oversight, only to be followed by noncompliance in furtherance of Pacific Bell's revenue goals when the special oversight ends."112 We conclude that our vigilance and enforcement can help ensure good service quality.
Our visual inspection of Pacific's residential initial out of service interval indicates an upward trend with the data doubling between 1994 and 1998. Between 1998 and 2001, the data nearly declines as mush as the prior increase. In contrast to residential, there is no observable trend change in the business initial out-of-service repair interval. When fitted with a straight line, the statistical analysis does not indicate any significant upward or downward trend in Pacific's performance in initial out-of-service repair intervals for business and residential customer groups.113 We note that the data begins to decline in 1999, a year prior to the ORA complaint filing. We cannot conclude to what effect, if any, initiation of the complaint proceeding had on the measure. However, we cannot alternatively conclude that the upward trend was influence by NRF or by factors outside the utilities control. The statistical analysis we use in this decision does not seek to explain the trend - only to identify its presence. In Phase 3B we will determine whether it is possible to and whether we should fashion a reasonable remedy to this.
Pacific's average performance is significantly worse than the reference group for residential lines, but the difference is not significant for the business lines.114 This leads us to the conclusion that Pacific's residential initial out of service interval lags behind national standards. Since, however, we see no statistically significant time trend and a visual pattern of service erosion followed by improvement, it is not reasonable to attribute any of the change in residential initial out of service interval to NRF regulation.
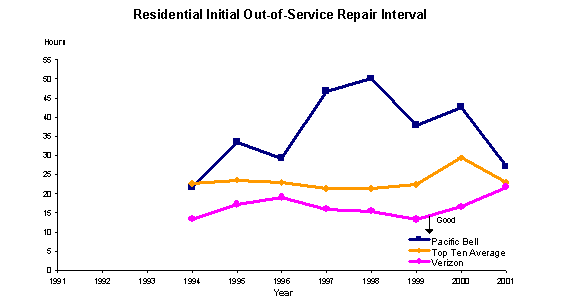
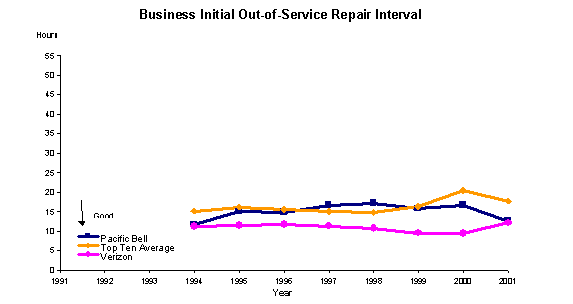
Our visual inspection indicates deterioration in Verizon's performance for residential lines, but its performance did not exhibit a statistically significant upward or downward trend.115 Verizon's average performance was significantly better than the reference group for residential and the business lines.116 Furthermore, Verizon's average performance is significantly better than Pacific.117 Since Verizon's performance is better than Pacific's and better than the reference group, we have no reason to attribute either trends in or the level of Pacific's initial out of service interval to the introduction of NRF regulation.
9. Repeat out-of-service repair interval (in hours): Pacific - Residential Significantly Worse Than Reference Group, Business Indistinguishable From Reference Group, No Significant Trend for Either; Verizon Residential and Business Significantly Better Than Reference Group, No Significant Trend for Either
Our visual inspection of the charts below indicates that Pacific's performance for residential nearly doubled between 1994 and 1998 then improved from the peak in 1999 and 2001, in contrast to business, which exhibits little variation. In fitting a straight line, the statistical test does not indicate any significant upward or downward trend in Pacific's performance in repeat out-of-service repair intervals for business and residential customer groups.118 Pacific's average performance is significantly worse than the reference group for residential lines but better for the business lines, however, the difference is not statistically significant for business lines.119 The fact that both the residential initial out of service interval and residential repeat out of service interval statistically exceed that of the reference group indicates that Pacific has a problem with this particular operation.
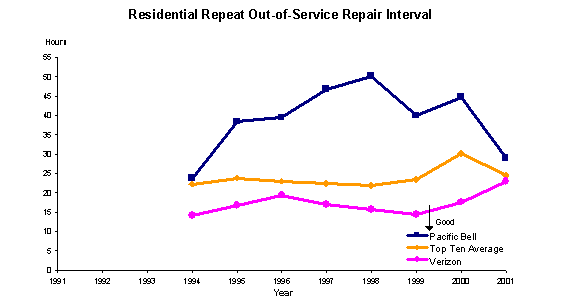
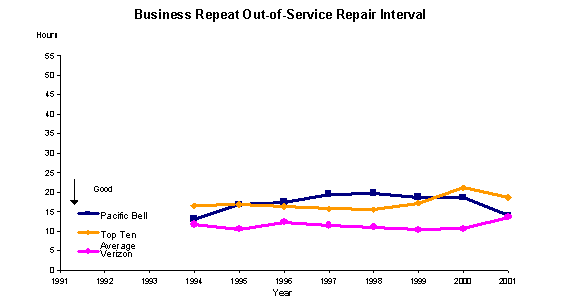
Verizon also did not exhibit any statistically significant upward or downward trend for residential and business lines.120 For both the residential and business lines, Verizon's performance was significantly better than the reference group.121 Verizon's average performance was significantly better than Pacific for residential and business lines.122
10. Initial all other repair interval (in hours): Pacific - Residential Significantly Worse Than Reference Group but No Significant Trend, Business Indistinguishable From Reference Group but Significant Improving Trend; Verizon Residential and Business Better Than Reference Group, but Significant Worsening Trend for Residential and No Significant Trend for Business
"Initial all other repair interval" is a grab-bag measure that captures repair intervals not covered in the prior categories.
On this measure, Pacific's performance data appears to trend upward and double between 1994 and 1997, then trend downward between 1997 and 2001. As a visual review of the graph below illustrates, Pacific has performed worse than the reference group except in 2001. Again, in contrast with residential, Pacific's performance for business lines appears more stable and exhibits an improving trend. In fitting a straight line, the statistical analysis shows that Pacific does not exhibit an upward or downward trend for residential lines and some improvement is observed for business lines.123 Pacific's average performance for residential initial all other repair interval was statistically worse than the reference group. However, for business service, Pacific's performance was not statistically different than the reference group.124
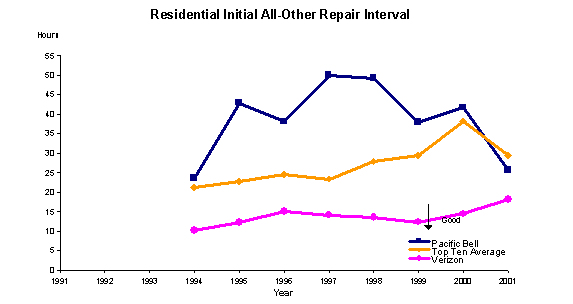
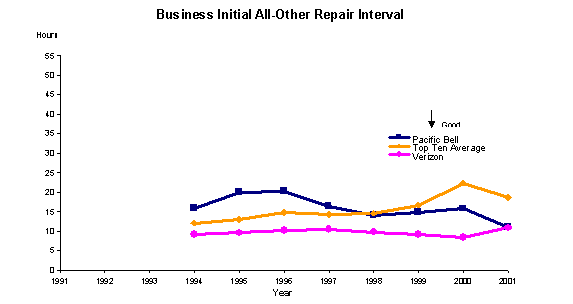
Over this period, Verizon achieved a much better record of performance. Visual inspection shows that Verizon outperformed the reference group for each measure. Verizon's performance, however, slightly deteriorated for the residential lines (although remaining better than that of the reference group), but did not exhibit any significant upward or downward trend for the business lines.125 Statistical analysis shows that Verizon's performance is significantly better than the reference group.126 Verizon's performance is also significantly better than Pacific's.127
11. Repeat All Other Repair Interval (in hours): Pacific - Residential Significantly Worse Than Reference Group, Business Indistinguishable From Reference Group, No Significant Trend for Either; Verizon - Residential and Business Better Than Reference Group, Significant Worsening Trend for Residential but No Significant Trend for Business
Visual inspection of the graphs below indicates that Pacific's residential repeat all other repair interval fluctuate over the NRF period. All other repair interval nearly doubled from 1994 to 1998, then declined from 1998 to 2001. In fitting a straight line to such a curvilinear trend, the statistical analysis indicates that Pacific's performance did not demonstrate any upward or downward trend for business and residential lines.128 Pacific's average performance is significantly worse than the reference group for the residential lines and the difference is not significant for business lines.129
Pacific showed a high level of repeat problems shortly after making an initial repair. In 2000, at least 2.73% of residential repeat out-of-service repairs occurred within 24 hours of a previous repair; the number in 2001 was 2.38%. In 2001, the number of repeat problems within one week of a previous repair was 6.76%, 8.84% within two weeks, and 10.10% within three weeks.130 It may be that these figures represented different problems for the same customers. Whatever the problem is, however, these high numbers certainly affected customers. The disruption caused by a repair is probably one of the more serious events that can occur in a carrier's relationship with its customers. A second repair within such a short time is an even more serious disruption.
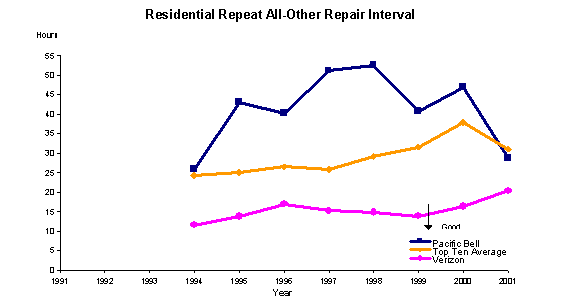
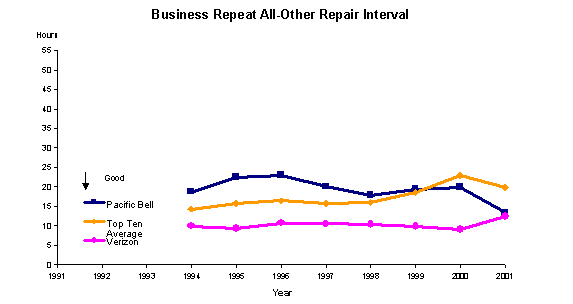
Verizon performance exhibits an upward trend for the residential customers, but its performance exhibits no significant change for the business lines.131 Verizon's average performance is significantly better than the reference group.132 It is also significantly better than Pacific.133
12. Average Installation Interval: Pacific and Verizon Indistinguishable From Reference Group and No Significant Trends
With regard to ARMIS data, Pacific claimed that, "both residential and business installation intervals in 2001 are below the level they were in 1994, the first year the data were reported."134
According to the data in the following graphs, Pacific's ARMIS performance on installation intervals (residential and business) was generally consistent over the 1994-2001 period. Pacific's data were slightly worse than Verizon's in 2000-01. As the graphs reveal, Pacific's installation intervals were generally better than Verizon's during the NRF period, with business installation intervals remaining stable in the 3-4 day range during the entire period 1994-2001. Residence intervals were not as steady, with small spikes in 1995 and 1997, but the overall numbers were generally lower than Verizon's except in 1994-95 and 2000-01. Concerning the reference group, it is difficult to draw any conclusions based on visual inspection. In some years, Pacific's performance exceeded that of the reference group, and in some years it did not.
The statistical analysis indicates that Pacific's performance does not exhibit an upward or downward trend.135 The average performance was not significantly different than the reference group.136
With respect to Pacific's installation data, ORA asserted that, "[Pacific's] ARMIS installation orders also include orders for vertical services such as Caller-ID and call waiting, as well as jack installations, etc. . . [and the] . . . increase in total installation orders reflects both the increased demand for access lines, and demand for new vertical services marketed in California during the mid to late 1990s."137 ORA alleged that in 1999, for example, Pacific had approximately 10 million more orders for vertical services and other local services only than it did for orders for basic service, and that vertical services orders contributed to the low reported average installation intervals because vertical services orders are completed within a day of placing the order resulting in installation intervals of 0 or 1 day. Pacific includes vertical services orders in its data, as the ARMIS measure clearly requires. Moreover, Pacific can install these services quickly and in automated fashion without dispatching a service technician. Thus, as the percentage of vertical services orders increases, the average installation interval will automatically fall. We have, however, no reason to believe that this trend for Pacific differs from the trends observed in our reference group. While Pacific asserts that "in most cases, Pacific's recent performance has improved relative to most of the years in which data were reported,"138 it did not show that the improvements in installation intervals were the result of actual improvement in performance instead of the result of an increasing proportion of "short interval" vertical services orders in the mix of installation interval data reported under ARMIS. Although this development makes the interpretation of this measure difficult, there is no easy remedy. A vertical service is indeed a service, should be measured, and has been part of this measure for a long time.
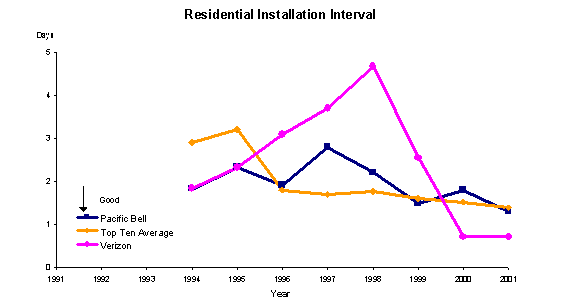
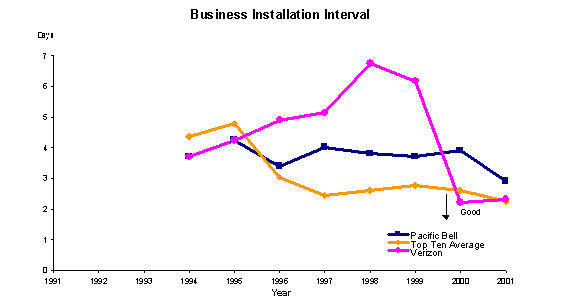
Turning now to Verizon, we note that it too includes vertical services in this measure, as do the reference utilities. With regard to installation intervals, the graph shows that Verizon performed less well than did Pacific for both residence and business installations from 1995-99, and that performance worsened between 1994 and 1998, doubling for residential lines from two to nearly 5 days, and nearly doubling for business from four to nearly seven days. In 2000-01, Verizon's performance improved: average installation intervals for residence customers decreased from nearly 5 days in 1998 to under 1 days in 2000 and 2001, while the same interval for business customers went from nearly 7 days in 1998 to just over two days in 2000 and 2001. The graph of Verizon's installation intervals exhibits significant volatility. When fitting a straight line to this curvilinear trend, it is not surprising that our statistical analysis shows that Verizon did not exhibit any statistically significant trend for residential and business lines.139 Its average performance is not significantly different than the reference group.140 Its average performance is not significantly different than Pacific, either.141 Thus, based on the linear statistical tests that we use, the great changes in Verizon's installation intervals over this period remain unexplained. We cannot even reach a statistical conclusion on exactly what is happening with Verizon concerning installation intervals. Because of this particular pattern of data, in the next phase of this proceeding, we will pursue whether an alternative statistical tests on this particular variable would better explain and/or measure what is happening with this variable.
13. Switch Downtime: Pacific - Significantly Better Than Reference Group with No Significant Trend; Verizon - Statistically Indistinguishable From Reference Group with Significant Worsening Trend
Switch downtime occurs when call processing capability for an end office is lost. This measure reports the switch downtime in minutes per switch experiencing downtime. As is shown in the chart below, Pacific has significantly improved its performance in the first few years of the NRF period. The statistical analysis shows that Pacific does not exhibit any statistically significant trend in downtime per switch down and performs better than the average of the reference group.142
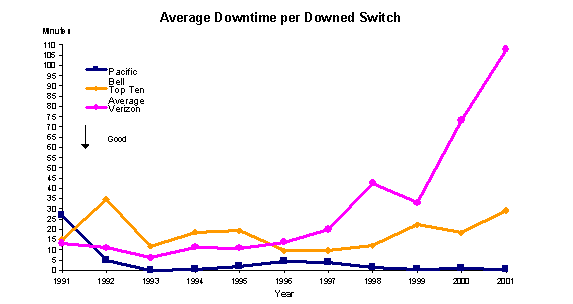
Verizon's downtime per switch exhibited an upward trend.143 Its average performance is significantly worse than Pacific.144 Verizon's average performance is also worse than the reference group, but the difference is not statistically significant.145
14. Switches Down per Switch
Pacific had only six observations for this measure. The statistical analysis shows that Pacific does not exhibit a statistically significant trend in the number of switches down per switch while Verizon exhibits a slight improvement in this area.146
15. Number of Switch "Occurrences": Pacific - "Under Two Minutes" Trend Improving, No Significant Trend for "Over Two Minutes" or "Percent Unscheduled"; Verizon - "Under Two Minutes" Trend Improving, But "Percent Unscheduled" Trend Worsening
Pacific reported three measures under this category: the number of occurrences over two minutes per switch (the number of incidents of switch downtime over two minutes in duration), the number of occurrences under two minutes per switch (the number of incidents of switch downtime under two minutes in duration) and the percent of occurrences unscheduled (the percent of incidents of switch downtime under two minutes in duration that are not scheduled for routine maintenance or network upgrades). Pacific's performance does not show a statistically significant upward or downward trend in the number of occurrences over two minutes per switch and the percent unscheduled. 147 Pacific exhibited a downward trend for the number of occurrences under two minutes per switch.148
Verizon had more data points for these measures. Verizon has exhibited a downward trend for the number of occurrences under two minutes per switch and an upward trend for the percent unscheduled.149
16. Installation Commitments Met: Pacific - Residential Performance Indistinguishable From Reference Group and No Distinguishable Trend, Business Significantly Better Than Reference Group But Trend Worsening; Verizon - Residential and Business Performance Indistinguishable From Reference Group with No Significant Trends
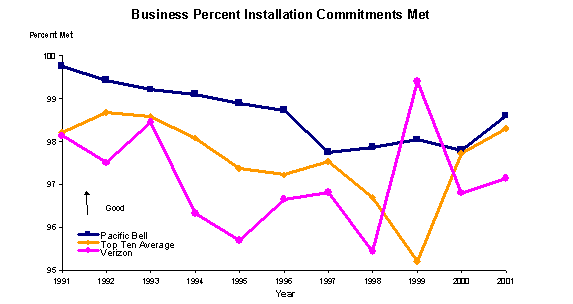
Pacific's residential installation "commitments met" data were consistently good from 1991-2001, with the exception of a dip in "commitments met" in late 1997. For business customers, the percentage of commitments met declined notably from 1991 through 1997, improving again in 2001. Pacific has demonstrated a slight downward trend for its residential lines but it is not statistically significant while it has shown a slight deterioration for business lines.150 Its performance is not statistically different than the reference group for the residential lines but it is better for the business lines.151
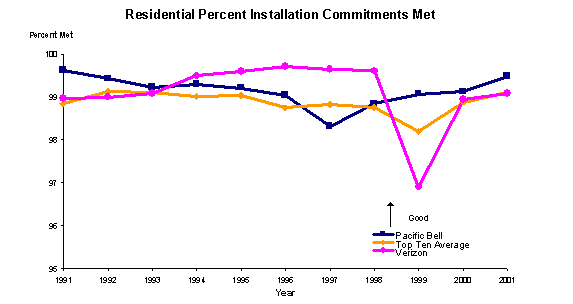
Other than in 1999, when Verizon's percentage of residential commitments met dipped to below 97%, Verizon performed well during the 1991-2001 period on its residential commitments. Its performance did not vary much from Pacific's, and neither party shows major problems in the "commitments met" area during the 1991-2001 period.
Verizon's results were less stable in the area of business commitments met, as the foregoing graph reveals. Verizon's results showed a general declining trend between 1991 and 1998 and were most problematic in 1995 and 1998, dipping to 96% and 95.5% of commitments met for business customers in those years. For all years except 1999, the data show that Verizon's performance was worse than Pacific's.
The statistical analysis indicates that Verizon did not exhibit any statistically significant upward or downward trend for the residential and business lines.152 Its performance is not significantly different than the reference group.153Verizon's performance is also not statistically different than Pacific's for residential lines but it is worse than Pacific for business lines.154
D. Summary of Empirical Assessment of Pacific's and Verizon's Performance on ARMIS 43-05 Measures
Concerning the ARMIS 43-05 measures, since there are no FCC service standards, we have compared the performance of Pacific and Verizon against a reference group of large utilities.
Compared to the reference group, Pacific's record on the six measures of trouble reports has been better than that of the reference group. Pacific also performed better than the reference group in switch downtime and installation commitments met (business). We have not observed a statistically significant difference between Pacific and the reference group on initial out-of-service repair interval (business), initial all other repair interval (business), repeat all other repair interval (business), average installation interval (residential and business), installation commitments met (residential). Pacific's performance lagged behind the reference group on the four residential repair interval measures: the initial out of service repair interval (residential), repeat out-of-service repair interval (residential), initial all other repair interval (residential), and repeat all other repair interval (residential).
PACIFIC ARMIS TO REFERENCE GROUP SUMMARY
Measure Type |
Significantly Better Performance |
Statistically Indistinguishable Performance |
Significantly Worse Performance |
Residential |
6 |
2 |
4 |
Business |
7 |
5 |
0 |
Bus. and Res. |
1 |
0 |
0 |
For Pacific, we statistically examined trends in performance during the NRF years. In particular, we find that during the NRF period Pacific's performance showed statistically significant improvement on initial trouble reports per 100 lines (business), repeat trouble reports per 100 lines (business), repeat out-of-service reports (business), initial all other trouble reports (business), repeat all other trouble reports (business), initial all other repair interval (business), and the number of occurrences under two minutes. Pacific has shown no statistically significant change in initial trouble reports (residential), repeat trouble reports (residential), initial out-of-service reports (residential and business), repeat out-of-service reports (residential), initial out-of-service repair interval (residential and business), repeat out-of-service repair interval (residential and business), initial all other repair interval (residential), repeat all other repair interval (residential and business), average installation interval (residential and business), switch downtime, installation commitments met (residential), the number of switches down, the number of occurrences over two minutes, and the percent of unscheduled occurrences. Pacific's performance has shown a worsening trend in initial all other trouble reports (residential), repeat all other trouble reports (residential) and installation commitments met (business).
PACIFIC ARMIS TREND SUMMARY
Measure Type |
Significantly Improving Trend |
No Statistically Discernible Trend |
Significantly Worsening Trend | ||
Residential |
0 |
10 |
2 |
||
Business |
6 |
5 |
1 | ||
Bus. and Res. |
1 |
4 |
0 | ||
From our statistical analysis, we note that Pacific had significant problems with both initial and repeat residential out of service repair intervals during a much of the period for which we have data. For both measures, repair intervals doubled from 1994 to 1998, a notable deterioration on an important measure. The repair intervals fell the most in 2001, after ORA filed its complaint alleging that Pacific's performance on these measures violated a previous Commission order. Largely because both measures data are curvilinear, e.g., show a significant deterioration from 1994 through 1998 followed by improvement back toward 1994 levels in the 1999 through 2001 periods, our statistical analysis does not show a statistically significant linear trend over the period under review. Nevertheless, we consider the decline in quality from 1994 to 1998 to have been a notable problem. Fortunately, the data show that Pacific is now headed in the right direction on this measure. Pacific did not have these same problems with business out of service intervals (both initial and repeat), for which Pacific's performance was relatively stable and not statistically different from the reference group.
Finally, we note that statistical methods we employ in this decision to identify trends are limited to linear trends. We hope that in future reviews of service quality, parties and the Commission will employ statistical methods that are better suited to analyze these type of performance.
We now turn to Verizon. Compared with the reference group, Verizon's record has been better in almost all measures. With respect to the important measures of out of service intervals, for both residential and business customers, the data show that Verizon did not experience the same problems as Pacific. However, for initial all other trouble reports (business), repeat all other trouble reports (business), average installation intervals (residential and business), switch downtime, and installation commitments met (residential and business), we have not observed any statistically significant difference between Verizon's performance and that of the reference group. Verizon's performance did not lag behind the reference group in any of the measures.
VERIZON ARMIS TO REFERENCE GROUP SUMMARY
Measure Type |
Significantly Better Performance |
Statistically Indistinguishable Performance |
Significantly Worse Performance | ||
Residential |
10 |
2 |
0 |
||
Business |
8 |
4 |
0 | ||
Bus. and Res. |
0 |
1 |
0 | ||
We also conducted a statistical examination of how Verizon's service quality changed over time. We find that during the NRF period, Verizon's performance showed statistically significant improvement on the number of initial trouble reports (residential and business), the number of repeat trouble reports (residential and business), the number of initial out-of-service trouble reports (business), the number of initial all other trouble reports (business), the number of repeat all other trouble reports (business), the number of switches down, and the number of occurrences under two minutes. Verizon's performance has not shown any statistically significant change in the initial out of service trouble reports (residential), repeat out-of-service trouble reports (residential and business), initial all other trouble reports (residential), repeat all other trouble reports (residential), initial out-of-service repair interval (residential and business), repeat out-of-service repair interval (residential and business), initial all other repair interval (business), repeat all other repair interval (business), average installation interval (residential and business), and installation commitments met (residential and business). Verizon's performance has shown a worsening trend only in initial all other repair interval (residential), repeat all other repair interval (residential), switch downtime, and the percent of unscheduled occurrences.
VERIZON ARMIS TREND SUMMARY
Measure Type |
Significantly Improving Trend |
No Statistically Discernible Trend |
Significantly Worsening Trend | ||
Residential |
2 |
8 |
2 |
||
Business |
5 |
7 |
0 | ||
Bus. and Res. |
2 |
0 |
2 | ||
Thus, we find that there is no evidence from Pacific and Verizon's performance that supports the hypothesis that NRF regulation decreases customer service quality.
E. MCOT Data
Both Pacific and Verizon have undergone changes as a result of large mergers they have entered into with other carriers. As a consequence of these mergers, the FCC has required specific reporting for time-limited periods so that it may monitor service quality impacts that may result from the mergers. (Throughout this proceeding, the parties have referred to these reports generically as "MCOT" requirements, and we use that nomenclature here.)155
1. MCOT Data - Pacific Shows No Service Diminishment Following Ameritech Merger
As a condition of SBC's merger with Ameritech, the FCC required additional quarterly, state-by-state service quality reporting for the period from June 1999 to November 2002.156 Categories of reporting for retail services include installation and maintenance, switch outages, transmission facility outages, service quality-related complaints, and answer time performance. The FCC based the reporting categories on the NARUC157 Service Quality White Paper, authored in 1998.158
In late 2000, the FCC notified SBC that, "[t]he quarterly service quality reports filed by SBC Communications, Inc. (`SBC') pursuant to the SBC/Ameritech Merger Order indicate that the quality of service provided by SBC's incumbent local exchange carriers (`LECs') has been deteriorating in several states since approval of the merger in October 1999." The FCC representative went on to state that, "I am concerned that SBC's performance data indicates that consumers in SBC's region are experiencing increasing installation delays, longer repair times, and greater difficulties contacting SBC's incumbent LECs about service quality and other issues. I note also that consumer complaints regarding service quality have increased in recent months in spite of SBC's explicit commitment when the merger was pending to devote greater resources to service quality after the merger closed."159
This comment offers an over-all assessment of SBC. We now turn to see how Pacific's service quality fared following the merger.
The FCC produced charts for certain measures for the period July 1999 to June 2001. According to these charts Pacific's performance shows negative spikes in California in the following areas: 1) answer time performance (business customers),160 2) trouble report rate per 100 lines (especially business customers),161 3) percentage of installation orders completed within 5 working days (especially residential customers),162 and 4) percentage of installation orders delayed over 30 days (business customers).163
These spikes, however, proved only transitory when subjected to statistical scrutiny. The data for these measures are also posted on the website for the period January 2000 through September 2001.164 In order to check whether there is a statistically significant upward or downward trend, we estimated a regression of Pacific's performance on a linear time trend. Our statistical analysis showed that Pacific's performance exhibits an improving trend in average answer time for residential and business customers.165 Pacific's performance in average trouble duration is also improving for residential and business lines.166 Pacific is also improving its performance in trouble report rate per 100 lines.167Pacific's performance does not show any change in installation completed within five business days for residential lines. 168 For business lines, our statistical analysis shows a slight improvement. 169
In summary, although the FCC has identified a trend of service deterioration in SBC affiliates following the Ameritech merger, Pacific's operations appear largely unaffected by the Ameritech merger. The few spikes in poor service proved transitory. Moreover, since the period for which we have MCOT data is so short and covers only part of the period subject to our investigation, it does not permit us to draw any conclusion concerning how NRF regulation affected Pacific's performance.
Recognizing the value of the MCOT reporting, during the hearings, Administrative Law Judge (ALJ) Sarah R. Thomas granted TURN's motion seeking an order requiring Pacific to continue to report certain data to this Commission for measures required under the FCC's MCOT requirements that expired in November 2002. (Verizon agreed with TURN voluntarily to continue the reporting until after a final decision in this proceeding.)
Judge Thomas ruled that Pacific should continue to report such information.170 She found that Pacific already has a mechanism in place to capture this data easily, that it has no plans to transfer or dismiss the employees who currently prepare the report, and that it would be wasteful to lose the important data the report captures at a time when the Commission is closely examining Pacific's service quality. We hereby ratify that ruling of the judge pursuant to Pub. Util. Code § 310. We require Pacific to continue reporting these results until further notice of the Commission.
2. MCOT Data - Verizon California (GTE) Shows No Diminishment of Service Quality Following Merger
The FCC also imposed a 36-month reporting requirement as a condition of the 2000 GTE merger with Bell Atlantic that created Verizon.171 As TURN pointed out in a motion filed during Phase 2B, the FCC requirement provides the Commission with information not otherwise available in GO 133-B. For example, while GO 133-B measures the handling of business office calls, it does not track billing calls even though such calls account for half of the calls to the business office.
According to the FCC data,172 Verizon showed negative spikes in California on several service quality measures at the following times during the period July 2000-June 2001, as compared to the rest of that period: 1) percentage of dissatisfied customers (with business customers reporting 50% dissatisfaction in November 2000 and residential customers reporting 20% dissatisfaction in March 2001),173 2) answer times (with business answer times in the 50-60 second range in September 2000 and in the 40-50 second range in January 2001 - as compared to a GO 133-B standard of 20 seconds); and residential times exceeding 20 seconds in November 2000 [30 seconds] and January 2001 [40 seconds],174 3) repair intervals for both residential and business customers spiking in the period January-March 2001,175 4) repeat trouble reports spiking for both types of customers in March 2001,176 and 5) trouble reports per hundred lines spiking in the January-March 2001 time period for residential customers.177 However, we have not observed a statistically significant upward or downward trend in Verizon's performance for the following measures: complaints per one million lines (residential and business),178 the percentage of dissatisfied customers (residential and business),179 answer times (business),180 average repair interval (residential and business),181 the percentage of repeat trouble reports (residential and business),182 trouble report rates (residential and business),183 the percentage of orders completed within five working days (residential and business),184 the percentage of orders delayed over 30 days (business).185 Verizon's performance shows a slight improvement in the percentage of orders delayed over 30 days for the residential lines186 and in the answer time performance for residential lines.187 As a result, we conclude that despite a visual spike illustrating a decrease in the quality of service in the January to March 2001 time period, there is no statistically significant indicator of an ongoing decrease in quality.
While Verizon voluntarily agreed to continue reporting this MCOT data, we will expand on that agreement to make it parallel with Pacific's, and require Verizon to continue to make its MCOT reports to this Commission until further notice.
159 Letter from Dorothy Atwood, Chief, FCC Common Carrier Bureau, to Mr. James W. Calloway, Group President - SBC Services, dated October 6, 2000, available at http://www.fcc.gov/wcb/mcot/SBC_AIT/service_quality/. We may take official notice of this letter pursuant to Commission Rule 73.
160 http://www.fcc.gov/wcb/mcot/SBC_AIT/service_quality/OP1.pdf. 161 http://www.fcc.gov/wcb/mcot/SBC_AIT/service_quality/RE3.pdf. 162 http://www.fcc.gov/wcb/mcot/SBC_AIT/service_quality/IN1.pdf. 163 http://www.fcc.gov/wcb/mcot/SBC_AIT/service_quality/IN2.pdf. 164 http://www.fcc.gov/wcb/mcot/SBC_AIT/service_quality/data.xls 165 For residential customers, the coefficient is -1.36 with t-statistic -3.12, significant at 1% level (R-square: 0.34, no. of observations: 21). For business customers, the coefficient is -0.46 with t-statistic -9.62, significant at 1% level (R-square: 0.83, no. of observations: 21). 166 For residential lines, the coefficient is -0.46 with t-statistic -9.62, significant at 1% level (R-square: 0.83, no. of observations: 21). For business customers, the coefficient is -1.50 with t-statistic -14.11, significant at 1% level (R-square: 0.91, no. of observations: 21). 167 For residential lines, the coefficient is -0.04 with t-statistic -3.64, significant at 1% level (R-square: 0.41, no. of observations: 21). For business lines, the coefficient is -0.02 with t-statistic -5.96, significant at 1% level (R-square: 0.65, no. of observations: 21). 168 The coefficient is zero with t-statistic 0.18, not significant at 1% or 5% level (R-square: 0.00, no. of observations: 12). 169 The coefficient is 0.003 with t-statistic 5.48, significant at 1% level (R-square: 0.75, no. of observations: 12). 170 20 RT 2529-31 (ALJ Thomas' ruling). 171 FCC 00-221, Condition 51. 172 We take official notice of this data pursuant to Rule 73. 173 http://www.fcc.gov/wcb/mcot/BA_GTE/service_quality/GTE_States/CU2.pdf. 174 http://www.fcc.gov/wcb/mcot/BA_GTE/service_quality/GTE_States/OP1.pdf. 175 http://www.fcc.gov/wcb/mcot/BA_GTE/service_quality/GTE_States/RE1.pdf. 176 http://www.fcc.gov/wcb/mcot/BA_GTE/service_quality/GTE_States/RE2.pdf. 177 http://www.fcc.gov/wcb/mcot/BA_GTE/service_quality/GTE_States/RE3.pdf. 178 For the residential lines, the coefficient is -0.30 with t-statistic -2.10, not significant at 1% or 5% level (R-square: 0.31, no. of observations: 12). For business lines, the coefficient is -0.21 with t-statistic -0.76, not significant at 1% or 5% level (R-square: 0.05, no. of observations: 12). 179 For the residential lines, the coefficient is 0.74 with t-statistic 1.24, not significant at 1% or 5% level (R-square: 0.13, no. of observations: 12). For business lines, the coefficient is -0.33 with t-statistic -0.35, not significant at 1% or 5% level (R-square: 0.01, no. of observations: 12). 180 For business lines, the coefficient is 0.25 with t-statistic 0.35, not significant at 1% or 5% level (R-square: 0.01, no. of observations: 12). 181 For the residential lines, the coefficient is 0.83 with t-statistic 1.24, not significant at 1% or 5% level (R-square: 0.13, no. of observations: 12). For business lines, the coefficient is 0.24 with t-statistic 1.73, not significant at 1% or 5% level (R-square: 0.23, no. of observations: 12). 182 For the residential lines, the coefficient is 0.09 with t-statistic 0.71, not significant at 1% or 5% level (R-square: 0.05, no. of observations: 12). For business lines, the coefficient is zero with t-statistic -0.06, not significant at 1% or 5% level (R-square: 0.00, no. of observations: 12). 183 For the residential lines, the coefficient is -0.005 with t-statistic -0.28, not significant at 1% or 5% level (R-square: 0.00, no. of observations: 12). For business lines, the coefficient is -0.004 with t-statistic -0.74, not significant at 1% or 5% level (R-square: 0.05, no. of observations: 12). 184 For the residential lines, the coefficient is 0.10 with t-statistic 0.57, not significant at 1% or 5% level (R-square: 0.03, no. of observations: 12). For business lines, the coefficient is 0.14 with t-statistic 0.63, not significant at 1% or 5% level (R-square: 0.36, no. of observations: 12). 185 For the business lines, the coefficient is approximately zero with t-statistic 1.19, not significant at 1% or 5% level (R-square: 0.36, no. of observations: 12). 186 For the residential lines, the coefficient is -0.001 with t-statistic -2.39, significant at 5% level (R-square: 0.36, no. of observations: 12). 187 For the residential lines, the coefficient is -1.71 with t-statistic -2.99, significant 5% level (R-square: 0.47, no. of observations: 12).


