V. Survey Data and Customer Satisfaction
A. Customer Satisfaction and Service Quality Surveys - Pacific
1. ORA Survey
At the Commission's direction, ORA's witness Dr. Marek Kanter readministered a survey of Pacific's customers based on one ORA conducted in 1995. Based on the responses given to 36 survey questions concerning service quality, ORA concluded that "Pacific's quality of service has declined in the period between 1995 and 2001."188
ORA's comparison showed problems in residential and small business customers' perceptions of Pacific's service quality. Of 36 questions in the survey germane to service quality, the responses to 23 questions showed a difference between customer perceptions in 1995 and 2001. In each of the following 19 questions, more customers chose a less favorable response in 2001 than they had in 1995:
· Q8. How often have you noticed static or noise on the line?
· Q9. How often have you noticed voices fading in or out?
· Q10. How often have you heard voices echoing?
· Q15. How often was the line dead upon picking up the phone?
(Questions 21-27 relate to "long distance calls carried by your local telephone company.")189
· Q21. How often have you noticed static or noise in the last 30 days?
· Q22. How often have you noticed voices fading in and out in the last 30 days?
· Q23. How often have you heard voices echoing in the last 30 days?
· Q24. How often have you not heard the other party in the last 30 days?
· Q27. How often have you been disconnected while talking in the last 30 days?
(Questions 31-32 relate to contacts with the local company's business office.)
· Q31. Were the office personnel assisting you courteous?
· Q32. Were you satisfied with the help you received from the office personnel?
· Q34. Regarding contacts with the local company's telephone operators, were you satisfied with the help you received from the operators?
(Questions 37-38 relate to telephone installation and repair.)
· Q37. Was the work completed on time?
· Q38. Were you satisfied with the work?
· Q40. Was your most recent local telephone bill correct?
· Q42. How would you rate your local phone service for the last 30 days?
· Q43. Compared with the last 6 months, rate your service in the last 30 days.
· Q44. What is your overall satisfaction with your local telephone service?
· Q46. Rate the service of [the] present provider, compared with previous providers you have had in the last three years.
For each of the following 4 questions, more customers chose a more favorable response in 2001 than they had in 1995:
· Q13. How often have you heard other voices on the line?
· Q16. How often have you reached a number not dialed?
· Q26. How often have you heard other voices on the line in the last 30 days?
· Q41. If your most recent bill was incorrect, has the problem been resolved?
Pacific's witness Dr. Hauser states that ORA's survey is "biased, noisy, and non-representative."190 Dr. Hauser's main objection is that the survey sample is not representative of all of Pacific's customers, due to nonresponse bias. He claims ORA lacked procedures to minimize nonresponse bias, and ORA's sample is highly likely to be biased towards customers who are more dissatisfied than the typical Pacific customer.191 Hauser also pointed out flaws regarding the ORA's statistical analysis: use of inappropriate and biased hypothesis tests, incorrect calculations of the joint significance tests, inappropriate comparisons over time and typographical mistakes.192 According to his analysis, if corrected, "37% of the statistically significant declines in service between 2001 and 1995 that ORA found are incorrectly labeled."193 Due to all these flaws and mistakes, Hauser claims that ORA's survey results are not a valid measure of Pacific's service quality.
ORA did not change the survey questions - again at the Commission's direction - because it wanted the results to be comparable over time. While Pacific criticizes the poor quality of the survey, we find that ORA did precisely what it was directed to do: use the same survey as it used in 1995 so as to have a basis to compare Pacific's results. In this regard, the Commission stated in the OIR that, "Parties that conduct surveys are encouraged to adhere to the following principles. First, in developing the survey, the party should use as a starting point the surveys of Pacific and Verizon customers conducted by Commission staff in previous proceedings."194
On the sample size, it is true that ORA did not follow up with customers in an attempt to increase the size of the sample of customers taking the survey. However, ORA did not follow up in 1995 either. As ORA points out, "had ORA attempted follow-up procedures that were different than the procedures in place in 1995, it would have lost the ability to do a fair comparison of the 1995 with the 2001 results." Dr. Kanter also explained that, "had I done follow-up phone calls, I would have changed the cast of characters, so to speak. The people responding would not have been as directly comparable to the people responding in 1995."195 This, however, creates a serious dilemma because the sharp drop in the response rate in the 2001 survey from that of 1995 limits our ability to draw conclusions from the survey with statistical confidence.196
However, while the ORA 2001 response rate is less than 50% of its 1995 rate, the total number of responses in 2001 is 881, which does provide some credibility to the findings.197 Further, a disparity in the response rate similarly occurred with the ORA survey of Verizon customers. Unfortunately, that ORA survey of Verizon took place in 1991, not 1995, thereby reducing the validity of the Verizon experience as a control. Nevertheless, we would expect a similar survey response for Verizon as to that of Pacific. Yet the findings of the ORA survey of Verizon are opposite that of its findings for Pacific. Such a difference suggests that the bias that Pacific's witness purports to exist is not powerful enough to explain away the general finding of the ORA survey: that there has been a diminishment in customers' perception of Pacific's service quality.
The methodological discussions brought up by Pacific in this proceeding regarding how to conduct a proper survey and analyze its results caution us on drawing conclusions based on ORA's survey instrument. As with almost all the other data presented in this proceeding, ORA's survey suffers from flaws. However, the survey still suggests that the consumer perception of Pacific's service quality fell between 1995 and 2001. For this reason, it is critical to turn to other surveys to see if this pattern is repeated or if Pacific's customers are not satisfied with Pacific's service quality.
2. Pacific's Surveys
a) J.D. Power Survey - Pacific
Pacific also submitted its own surveys. A global marketing information firm J.D. Power conducted one of them. Even though Pacific submitted little information about what the survey asked customers, Pacific's witness, Dr. Hauser, explained that these surveys did not "measure satisfaction with recent service events with Pacific (e.g., installations or repairs), but rather provided a general measure of satisfaction with overall customer service and its aspects."198 That is, overall customer satisfaction is determined "by surveying over 12,000 households on the areas of customer service, cost of service, corporate image, call quality, promotions, billing, calling cards, and operator service."199
Pacific received a score of 110 in 2001 from J.D. Power, where 104 is the industrial average score.200 Furthermore, Pacific is ranked in the top six out of the sixteen local service providers surveyed. 201 Pacific's witness, Dr. Hauser also stated that Pacific has consistently exceeded the industry average for every year from 1996 to 2001 and it has consistently ranked in the top six of local service providers.202
The information Pacific submitted indicated that the survey also included several factors that we consider peripheral to a true assessment of service quality, such as "corporate image" (which respondents ranked as one of the top three factors relevant to customer satisfaction, with 21% finding it important), "cost of service/value" (with 24%) and "calling card," which appear to relate to Pacific's prices and calling card services. These are not elements of service quality as examined in this decision. Thus, the J.D. Power surveys broader aspects of service quality than are the focus of our study. Nevertheless, it provides evidence that indicates that consumers are satisfied with Pacific's assessment of service quality.
b) IDC Survey - Pacific
Pacific's expert Dr. Hauser also summarized the results of a 2000 survey of various local exchange carriers by IDC, entitled "Telecommunications Consumer Brands Survey." According to Dr. Hauser, IDC is "a leading provider of technology forecasts, insights and advice."203 Dr. Hauser reported that the IDC survey found that Pacific's customers are more satisfied than the average local telephone customer for all attributes studied except one; Pacific's customers are the second most overall satisfied for customer service; Pacific's customers are the third most satisfied for voice quality; and Pacific is one of the top three providers in over 85% of the areas measured. According to Dr. Hauser, the IDC survey polled 805 households nationally, and measured local telephone service customers' satisfaction with "customer service, fees, marketing, reputation, pricing-structure and voice/service quality."204
Attachment 31 to Dr. Hauser's testimony summarizes the results of the IDC study. Two indicia of service quality contained in the survey are "customer service" and "voice or service quality."205 For "customer service," 73.8% of respondents ranked Pacific as a 4 or 5 (with 1 = not very satisfied, and 5 = very satisfied). This places Pacific in the middle of the range for comparable carriers. Of the non-SBC companies, GTE/Verizon's comparable result was 83.1%, Bell Atlantic's was 80.7%, and Bell South's was 72.6%, and US West's was 63.1%.
Similarly, on "voice or service quality," 85.7% of customers ranked Pacific a 4 or 5. Of the non-SBC companies, Bell South scored 86.3, GTE scored 85.9, US West scored 83.8, and Bell Atlantic scored 83.5. Thus, when analyzing the tale of the distribution - those most satisfied - Pacific's results for these two measures are comparable to the other non-SBC carriers' results.
Unfortunately the sample size of this survey was small. Pacific's witness recognized the survey results might not be statistically different from the results of other LECs.206 Thus, the results of this survey are not conclusive, although they do provide directional indication on comparisons of customer satisfaction.
c) Other Customer Surveys - Pacific
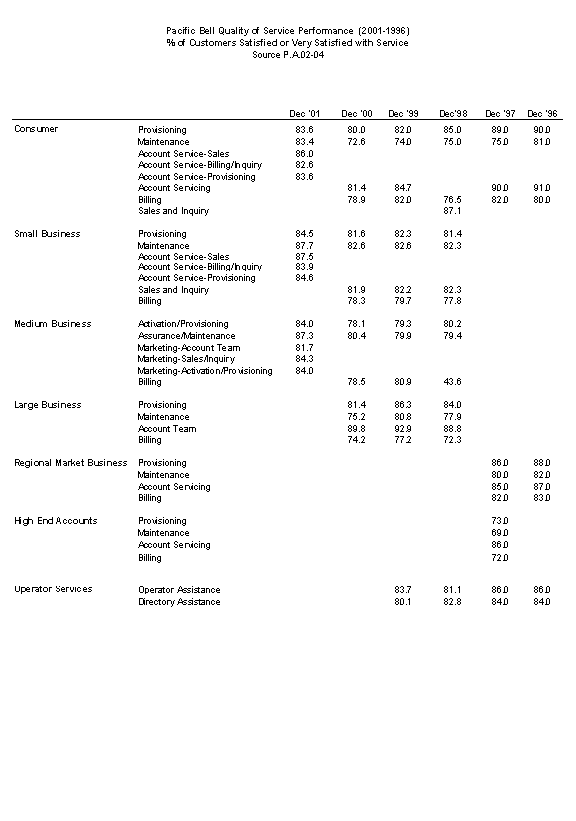
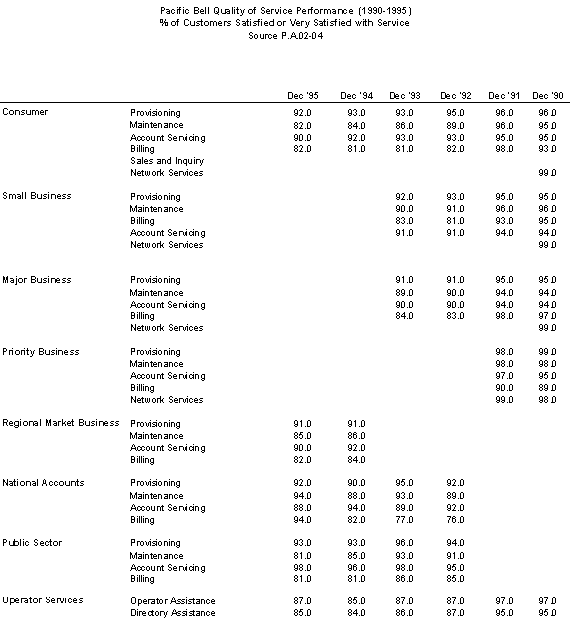
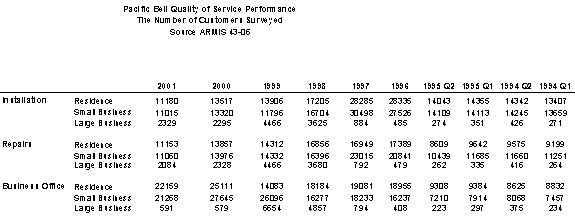
Pacific's witness, Dr. Hauser, explained that Pacific has a centralized organization that collects data on an ongoing basis by surveying customers with recent service interactions with Pacific. A sample of the customers is surveyed by an independent marketing firm, Market Insights, every month, 7-10 days after the service event and asked about their interaction with the business office and network operations.207 These surveys are the source of data provided to the FCC in the ARMIS 43-06 reports.208 The survey results are also reported to the CPUC under the P.A. 02-04 reporting requirement. The tables below summarize Pacific's performance from 1990 through 2001. The December measures reported includes the result for the previous 11 months as well, and therefore offers a tabulation of the entire year.


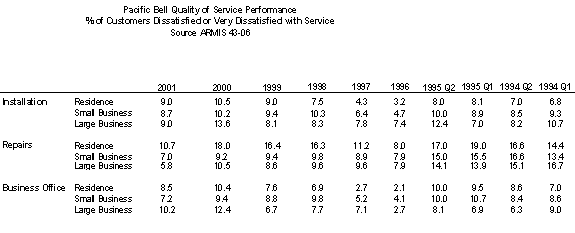
While Pacific reports the CPUC the percentage of the customers satisfied or very satisfied with Pacific's service, it also reports to the FCC the percentage of the customers dissatisfied or very dissatisfied with service as shown in the table below.


Unlike the surveys discussed before, in these surveys "customers rate their overall satisfaction with their service interaction. In addition to their satisfaction with the service event, customers are asked about the ease of getting through to the office as well as several questions that measure the skill of the Pacific representative answering the call, e.g., was the representative courteous, and the performance of the Pacific service technician who performed any necessary repairs, e.g., doing quality work and completing the work in a timely manner."209
Pacific has modified the surveys over the years by changing its rating scale in 1992 and 1998. The wording was also changed in 1998, with further changes following in 1999.210 Consequently, as Pacific's witness, Dr. Hauser stated "In the Pacific CSQ survey, it is extremely difficult to compare responses prior to January 1998 with responses after the change in wording.211 Therefore, he compared the data for the years 1994-1997 and 1998-2001 and presented the results in Attachment 32 and 33 of his testimony. According to Dr. Hauser, "Pacific's customers who are surveyed about repair work are three to six percentage points less dissatisfied than the average of the top ten LECs. Furthermore, Pacific's customers are less dissatisfied about the business office and installation work for each customer group surveyed. This analysis suggests that Pacific's service is good relative to its peers in 2001."212 Dr. Hauser also examined the percentage change between 1998 and 2001 and reported the results in Attachment 32 of his testimony. According to his findings, Pacific's customers' dissatisfaction rose for only installation services for residential and large business customers and business office services for residential and large business customers. The dissatisfaction declined for all other services and categories. In comparison, over the same period, the dissatisfaction for the services of the reference group rose for all categories except for repair services for large business customers. Pacific's witness Mr. Flynn identified dissatisfied ratings as relatively stable from 1994 through 2001.213
During the audit phase of this proceeding, the Commission's consultant, Overland Consulting (Overland), alleged that Pacific used a third-party research firm to conduct customer satisfaction surveys during the NRF period, and that Pacific did not file the surveys with the Commission as required by the NRF monitoring program.214 According to Overland, the surveys were conducted under Pacific's Customer Service Quality (CSQ) process, and surveyed customers who had recent experience with Pacific in the areas of sales, billing, maintenance, installation, and operator services.
Overland reported that Pacific should have filed the surveys under NRF monitoring report P.A. 02-03, and that Pacific refused Overland's requests for copies of the surveys. In response to Overland's assertion that Pacific failed to file the surveys as required, Pacific states, "It is possible Overland has confused two monitoring reports, P.A-02-03 and P.A-02-04. Pacific understands that P.A-02-03, Customer Survey Report, refers to surveys initiated by the Commission . . . ."215 Pacific argues that it should not be obliged to produce its customer surveys because the requirement "has not been raised by the Commission or its staff in the last 11 years. . . ."216
We have reviewed the origins and purposes of reports P.A. 02-03 and P.A. 02-04, and find substantial confusion. In 1991, the Commission in D.91-07-056 also directed the staff to produce "a written assessment explaining who prepares each monitoring report that the utilities provide to our staff, and what purpose each of these reports serves for the utility and for the staff."217 The staff's Monitoring Report Assessment, filed on May 1, 1992, contained the following description of "Customer Surveys" Pacific is required to file under report P.A. 02-03:
6. Customer Surveys: These surveys are given to customers who have direct contact with Pacific Bell and are used to measure customer satisfaction levels and perceptions of the company. These surveys are conducted through the Corporate Research organization at Pacific Bell, and historically have been provided to the DRA Telecommunications Rate Design Branch, and is [sic] used in DRA's ongoing service quality evaluation. The surveys are provided as initiated. It is recommended that these surveys continue."218
This appears to accurately describe the data submitted under PA 02-04.
The Monitoring Report Assessment also describes a separate set of ongoing survey results that Pacific is required to file monthly under Report P.A. 02-04, as follows:
"7. Quality of Service Performance - Customer Opinion Surveys: These surveys are conducted by the Company Measures and Statistics organization at Pacific Bell. A monthly report identifying the percentage of customers that are satisfied with Pacific Bell's service quality is provided to the DRA Telecommunications Rate Design Branch. DRA uses the information in these reports is used in it's [sic] service quality monitoring efforts. It is recommended that these surveys continue."219
The reports submitted under PA 02-04 do not appear to meet this description.
Pacific asserts that the P.A. 02-03 report refers only to surveys initiated by the Commission. Pacific's witness states that, if Pacific's understanding of its reporting obligation is incorrect, neither the Commission nor its staff has raised it as an issue in all the prior years of NRF monitoring. From the record of this proceeding, it is unclear whether any other survey data exist.
Despite the controversy surrounding the existence of PA.02-03 surveys, the extensive PA. 02-04 data were only minimally addressed in this proceeding by ORA. In addition, Pacific's ARMIS 43-06 service quality data was not discussed by ORA. TURN cited D.01-12-021 and stated that "there is nothing in the record of this proceeding that warrants the Commission revisiting the conclusion it reached in D.01-12-021 - the customer perception measured by the ARMIS data is not synonymous with Pacific's achieved level of service quality."220
Although our previous decision rightly cautions reliance on survey data as a full measure of service quality, TURN's citation to this decision is irrelevant for the matter before us. Here, we use survey data as part of a systematic assessment of service quality that relies principally on the statistical analysis of direct measures of service quality. The failure of ORA and TURN to address this survey data is disappointing, and confirms our independent judgment that Pacific's surveys are accurate. Moreover, their principal finding of consumer satisfaction is consistent with the conclusion that we have drawn from our analysis of direct measures - Pacific's overall performance is good.
In conclusion, we note that Pacific has fully reported on its P.A. 02-04 surveys, which show a record of strong customer satisfaction. We find no reason to believe that anything other than a good-faith confusion has led to the lack of reports to be filed under P.A. 02-03. We will resolve this reporting confusion in the next phase of this proceeding. The central question that we will address is whether Pacific has provided the Commission all the data that it has. From our review of the record, it appears that this simple question was never directly asked or answered.
B. Customer Satisfaction and Service Quality Surveys - Verizon
1. ORA Survey
ORA's customer service quality survey for Verizon showed that in the minds of the customers surveyed, Verizon's service quality has improved since 1991.
2. Verizon's Surveys
Verizon claims it surveys its California customers by conducting over 1,000 interviews per month covering Directory Assistance, Consumer and Business Provisioning (which covers installation of new service), Consumer and Business Repair (which covers diagnosis, repair, and restoration of existing service), and Consumer and Business Request and Inquiry (which covers requests and inquires directed to the Business Office regarding customer bills, products and services, prices, and company policies).221 The results of these surveys show that Verizon offers good service quality. Neither ORA nor TURN challenged the results of these surveys.


