10. Assignment of Proceeding
Loretta Lynch is the Assigned Commissioner and Meg Gottstein is the assigned Administrative Law Judge in this proceeding.
1. Parties in this proceeding agree that the proposed Path 15 upgrades ("the project") are not needed for system reliability purposes, but disagree on whether there is an economic need for the project.
2. The assessment of economic need assumes that the project will cost a total of $323 million, or approximately $50 million per year on an annualized basis.
3. The project is evaluated on a "stand-alone" basis in this proceeding, i.e., without considering the manner in which PG&E and other entities will participate in the project.
4. The ISO's assessment of the economic benefits associated with the project hinges on the presumption that the market abuses experienced in 2000 will persist in the industry in 2005 and beyond. It identifies suppliers that can exert market power, assumes that they cannot be thwarted in establishing high price-cost markups by any other means than constructing more transmission, and uses the resulting market-abuse baseline to evaluate the project.
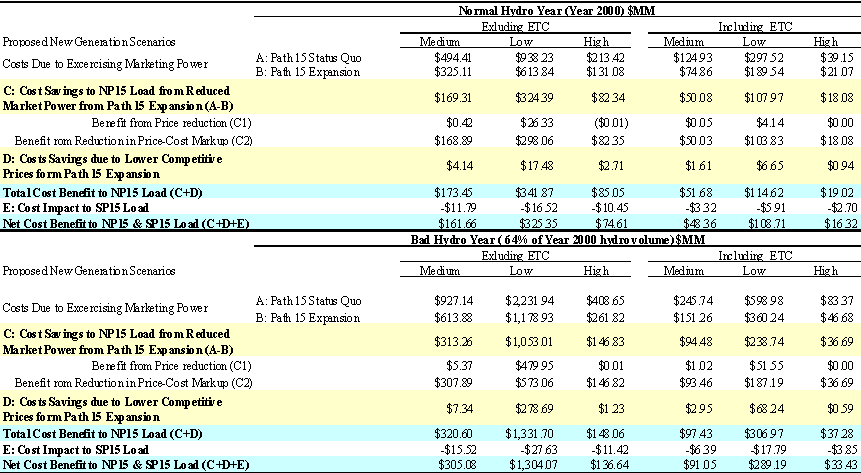
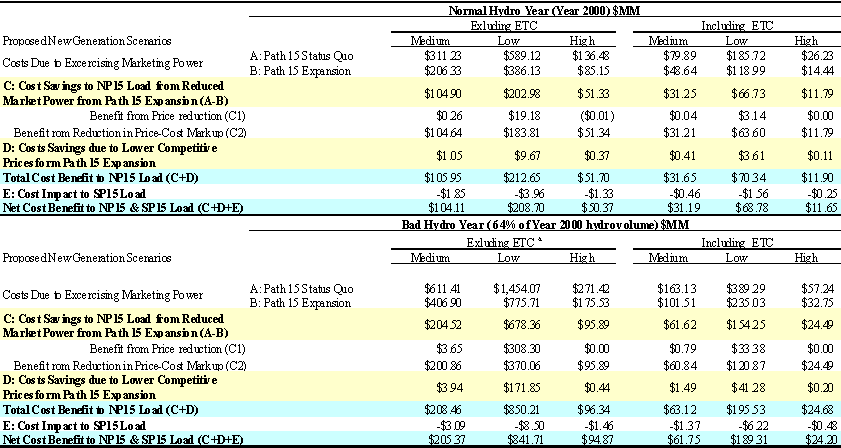
5. The ISO's consultant, London Economics, found that adding transmission capacity provides relatively little economic benefit to ratepayers when contract coverage and/or demand-responsiveness programs are put in place to mitigate market power.
6. The ISO's analysis ignores the initiatives that have been put in place by the Commission and other agencies since 2000 to address market power abuses and mitigate transmission congestion, such as forward contracting, demand-responsiveness programs and incentives for distributed generation. It also presumes that regulators will fail to take any other actions to address market power abuses in the future.
7. By establishing the baseline for its market power study in the manner described above, the ISO's analysis results in inflated project benefits.
8. The ISO's market power study also ignores forward contracting in the underlying calculations of RSI values and the Lerner Index. This omission further biases the results in favor of project construction.
9. The validation assessment performed at the ALJ's request in this proceeding documents the upward bias of the ISO's modeling method and, more generally, illustrates its predictive weakness.
10. The regression results used by the ISO to predict price-cost markups in 2005 do not meet the ISO's own criteria for statistical validation during six months out of the year.
11. None of the evidence in this proceeding suggests that the disappearance of all forward contracting in 2005 and beyond is plausible. This assumption is used for 12 out of the 24 scenarios presented in the ISO's market power study.
12. Six of the remaining ISO scenarios ("exclude ETCs") assume that the inefficient use of ETCs in 2000 will continue in 2005 and beyond without regulatory intervention.
13. The method used by the ISO to try to capture the impact of continued ETC inefficiency on the economics of the project appears to inflate the estimated benefits in the six scenarios that exclude ETCs. This is because the ISO subtracts the full amount of ETC capacity reserved in 2000 from operational transmission capacity in these scenarios, rather than the amount of unscheduled ETC capacity.
14. Even if it were appropriate to subtract the full ETC reservation amount from operational transmission capacity, the evidence indicates that this amount will be significantly reduced in the years 2005 and beyond because over 45% of the ETC contract capacity will expire between 2004 and 2008.
15. In the six scenarios that remain, the ISO estimates that only three of them produce benefits that exceed the estimated annual project cost of $50 million. These three scenarios assume one-in-ten year drought conditions, low generation development in northern California and the Pacific Northwest, or both. For every five years of average hydro conditions, California would need eight years of drought conditions for the project to break even.
16. The ISO's study based on competitive market prices is the closest approximation to a study that acknowledges the various market power mitigation strategies currently in place and those that will be in place between now and 2005.
17. Under the competitive market study, annual project costs exceed benefits by $47 million per year or more in all of the scenarios where either (1) average hydro year conditions or (2) medium or high new generation in northern California are assumed.
18. Under the competitive market study, annual project benefits are greater than costs in only two scenarios, where one-in-ten year drought conditions and low new generation build-out in northern California are assumed. One of these scenarios excludes all ETC capacity.
1. The ISO's market power study does not produce reliable or reasonable estimates of economic benefits with which to assess the project. Even if we could rely on the estimates produced by this study, the results indicate that the benefits of the project would not catch up with estimated costs within a ten-year period, except under implausible scenarios.
2. Under the ISO's study that assumes competitive market pricing, the project would not be a cost-effective investment for ratepayers unless we believe that (1) low new generation build-out for northern California and the Pacific Northwest is likely and (2) there will be a greater number of years with drought conditions in the future than years with average hydro conditions.
3. Based on the record in this proceeding, the proposed upgrades to Path 15 are not cost-effective to ratepayers on a stand-alone basis.
IT IS ORDERED that Pacific Gas and Electric Company shall not proceed to construct this project on a stand-alone basis or in participation with other entities, until further Commission order.
This order is effective today.
Dated , at San Francisco, California.
ATTACHMENT 1
LIST OF APPEARANCES
ATTACHMENT 2
LIST OF ACRONYMS AND ABBREVIATIONS
ATTACHMENT 2
LIST OF ACRONYMS AND ABBREVIATIONS
A. Application
ALJ Administrative Law Judge
CEC California Energy Commission
CDWR California Department of Water Resources
CPCN Certificate of Public Convenience
D. Decision
DWR Department of Water Resources
Exh. Exhibit
ETCs existing transmission contracts
FERC Federal Energy Regulatory Commission
I. Investigation
ISO Independent System Operator
kV kilovolt
LADWP Los Angeles Department of Water and Power
MSCG Morgan Stanley Capital Group
MW Megawatt
MOU Memorandum of Understanding
NP15 north of Path 15
ORA Office of Ratepayer Advocates
PG&E Pacific Gas and Electric Company
PHC prehearing conference
RT Reporter's Transcript
RSI Residual Supply Index
SCE Southern California Edison
SP15 South of Path 15 zone
TANC Transmission Agency of Northern California
Trans-Elect Trans-Elect, Inc.
WAPA Western Area Power Administration
ZP26 Zone south of Path 15, but north of Path 26
(END OF ATTACHMENT 2)
LIST OF TABLES AND FIGURES
TABLE 1
TABLE 1: ISO's Competitive Market Study ISO COMPETITIVE MARKET STUDY | |||||||
(Annual Benefits, Levelized Costs and Net Benefits) |
|||||||
SCENARIO ASSUMPTIONS |
|||||||
Hydro |
ETC |
|
New gen. |
Re-dispatch benefits ($ million) |
Load cost benefits ($ million) |
Costs ($ million) |
Annual Net ($ million) |
Dry |
Include |
- |
High |
$0.51 |
-$7.47 |
$50.00 |
-$56.96 |
Dry |
Include |
- |
Medium |
$1.14 |
-$7.43 |
$50.00 |
-$56.29 |
Normal |
Include |
- |
High |
$0.33 |
-$2.86 |
$50.00 |
-$52.53 |
Normal |
Include |
- |
Medium |
$0.44 |
-$2.44 |
$50.00 |
-$52.00 |
Normal |
Include |
- |
Low |
$0.93 |
$2.09 |
$50.00 |
-$46.98 |
Sensitivity 3 |
Include |
- |
Low |
$1.35 |
$4.10 |
$50.00 |
-$44.55 |
Sensitivity 2 |
Include |
- |
Low |
$2.41 |
$14.01 |
$50.00 |
-$33.58 |
Sensitivity 1 |
Include |
- |
Low |
$4.60 |
$41.70 |
$50.00 |
-$3.70 |
Dry |
Include |
- |
Low |
$9.02 |
$83.05 |
$50.00 |
$42.07 |
Dry |
Exclude |
- |
Low |
$16.42 |
$118.55 |
$50.00 |
$84.97 |
TABLE 2
TABLE 2: ISO MARKET POWER STUDY (Annual Benefits, Levelized Costs and Net Benefits) | ||||||||
SCENARIO ASSUMPTIONS: |
||||||||
Hydro |
ETC |
Long-term contract |
New gen. |
Benefits ($ million) |
Costs ($ million) |
Annual Net ($ million) | ||
Normal |
Include |
Include |
High |
$11.65 |
$50.00 |
-$38.35 | ||
Normal |
Include |
Exclude |
High |
$16.32 |
$50.00 |
-$33.68 | ||
Dry |
Include |
Include |
High |
$24.20 |
$50.00 |
-$25.80 | ||
Normal |
Include |
Include |
Medium |
$31.19 |
$50.00 |
-$18.81 | ||
Dry |
Include |
Exclude |
High |
$33.43 |
$50.00 |
-$16.57 | ||
Normal |
Include |
Exclude |
Medium |
$48.36 |
$50.00 |
-$1.64 | ||
Normal |
Exclude |
Include |
High |
$50.37 |
$50.00 |
$0.37 | ||
Dry |
Include |
Include |
Medium |
$61.75 |
$50.00 |
$11.75 | ||
Normal |
Include |
Include |
Low |
$68.78 |
$50.00 |
$18.78 | ||
Normal |
Exclude |
Exclude |
High |
$74.61 |
$50.00 |
$24.61 | ||
Dry |
Include |
Exclude |
Medium |
$91.05 |
$50.00 |
$41.05 | ||
Dry |
Exclude |
Include |
High |
$94.87 |
$50.00 |
$44.87 | ||
Normal |
Exclude |
Include |
Medium |
$104.11 |
$50.00 |
$54.11 | ||
Normal |
Include |
Exclude |
Low |
$108.71 |
$50.00 |
$58.71 | ||
Dry |
Exclude |
Exclude |
High |
$136.64 |
$50.00 |
$86.64 | ||
Normal |
Exclude |
Exclude |
Medium |
$161.66 |
$50.00 |
$111.66 | ||
Dry |
Include |
Include |
Low |
$189.31 |
$50.00 |
$139.31 | ||
Dry |
Exclude |
Include |
Medium |
$205.37 |
$50.00 |
$155.37 | ||
Normal |
Exclude |
Include |
Low |
$208.70 |
$50.00 |
$158.70 | ||
Dry |
Include |
Exclude |
Low |
$289.19 |
$50.00 |
$239.19 | ||
Dry |
Exclude |
Exclude |
Medium |
$305.08 |
$50.00 |
$255.08 | ||
Normal |
Exclude |
Exclude |
Low |
$325.35 |
$50.00 |
$275.35 | ||
Dry |
Exclude |
Include |
Low |
$841.71 |
$50.00 |
$791.71 | ||
Dry |
Exclude |
Exclude |
Low |
$1,304.07 |
$50.00 |
$1,254.07 | ||
Source: Exh. 201, Attachment 4 |
||||||||
TABLE 3
Table 3: Summary Results of Estimated Cost Savings to
NP15 Load from Path 15 Expansion (Excluding Long-term Contracts)1

TABLE 4
Table 4: Summary Results of Estimated Cost Savings to
NP15 Load from Path 15 Expansion (Including Long-term Contracts)2

FIGURE 1


