Figure 1: Path 15
Source: Exh. 201, Attachment 3, Figure 2.1
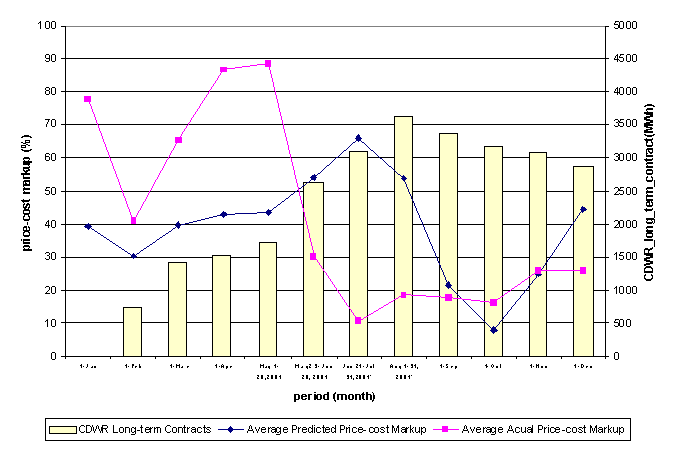
FIGURE 2
Figure 2. Comparison of Average Simulated Price-cost Markups and
Average Actual Price-cost Markups (2001)59

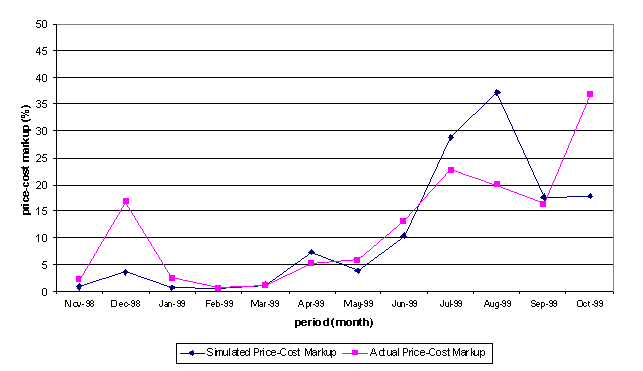
FIGURE 3
 Figure 3. Comparison of the Simulated Price-cost Markups and Actual Price-cost Markups
(November 1, 1998 to October 31, 1999)60
Attachment 1 to I0011001 A0104012 - List of Appearances
59 For the simulation in 2001, a simple average of the CA ISO's real-time incremental prices and regional hub prices is used as a measure of daily spot market energy prices. The regional hub price is computed as an average of COB and Palo Verde prices and is computed for peak and off-peak hours separately. SOURCE: Exh. 221, p. 4.
60 For the simulation from November 1998 to October 1999, the regional energy price is computed as the weighted average of real-time price and the CA PX price. The weights are real-time INC volume and CA PX transaction volume netting out the Utility Distribution Companies' own generation. SOURCE: Exh. 221, p. 7.


