III. The Proposed Plans
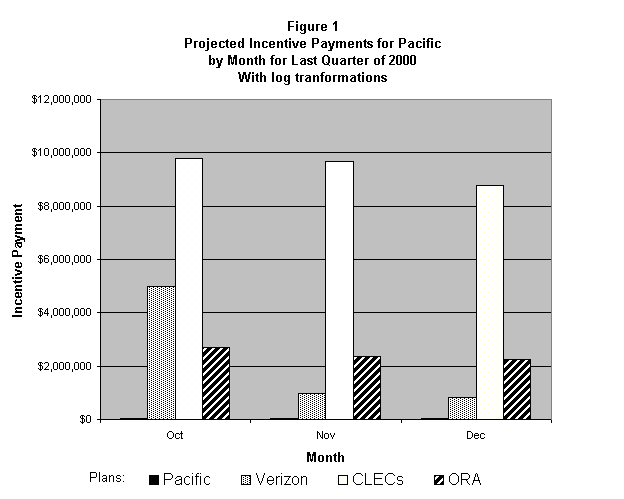
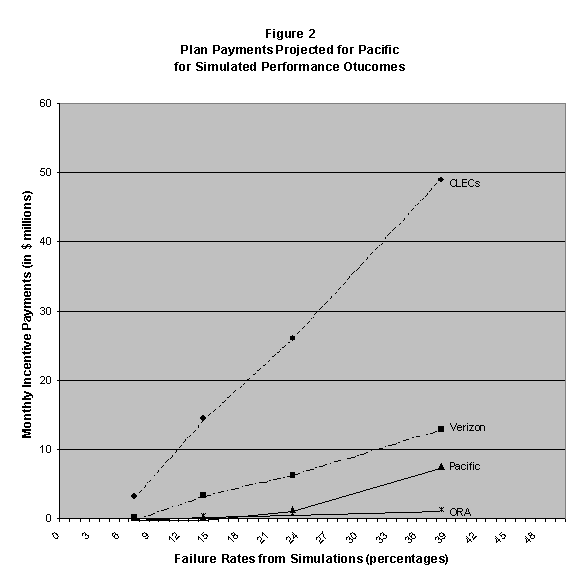
Pacific, Verizon, ORA, and the CLEC group each filed a different plan. The monetary outcomes varied greatly. Figure 1 shows the different monetary amounts that each plan would require Pacific to pay per month under the performance conditions Pacific and CLECs experienced in the last quarter of 2000.11 Figure 2 shows the amounts that would be paid per year under different assumptions about future performance.12
We summarize each proposed plan briefly by discussing the primary components of the plans and the major differences between them. The complete details of each proposed plan were filed in this proceeding as noted below in the discussion of each plan.
A. Pacific's Proposed Plan
Pacific's proposed plan is documented in its March 23, 2001 filing in this proceeding.13 Pacific's performance incentives plan has a monthly payment cap equal to three percent of its annual net return from local exchange service. Thus, on a yearly basis, the maximum available payment amount would equal thirty-six percent of Pacific's annual net return from local exchange service. These amounts are approximately $46 million monthly and $550 million yearly.14 However, the full amounts would not be paid absent a formal Commission review. A maximum of $10 million total per month and $3 million per CLEC per month could be paid without review in a formal proceeding. Pacific Plan at 3, (March 23, 2001).
Pacific's plan pays Tier I assessments to the CLECs, and Tier II assessments to either the CLECs or a public fund. Tier I assessments are based on each CLEC performance result regardless of the volume of transactions. For example, if one CLEC's results are identified for payment on a sub-measure such as phone service provisioning, and it had 10 transactions (in this case provisioning orders), and another CLEC's results for the same sub-measure are identified for payment based on 300 transactions, the payments would be equal. Pacific's plan would not adjust payments based on the severity of poor performance. Tier II assessments are made by combining all CLEC results for each sub-measure to create an industry-wide assessment of sub-measure performance. Only sub-measures with an all-CLEC total of 30 transactions or more are assessed for Tier II payments. Id. at 11.
Pacific's plan "forgives" statistically identified failures that under optimal conditions could be attributed to random variation.15 With the 0.10 critical alpha required by D.01-01-037, under these optimal conditions we should expect an average of 10 percent of the statistical test results to be identified as performance failures even when parity exists.16 Pacific's plan assumes that the percent of failures will vary from the ten percent average each month, and bases its number of "forgiven" failures on a statistical estimate, "F," representing the most failures that can be expected ninety percent of the time.17 Id. Thus for single-month performance results, Pacific's plan requires no payments when "F" or fewer tests fail. Currently, fewer than "F" tests are failing each month.18 When more than "F" tests fail, Pacific's plan will only require payments for the number of failures that exceed "F." For example, if "F" represented twelve percent of the statistical tests, and fourteen percent of the tests failed, Pacific would only be assessed payments for two percent of the test results.
The payment amounts in Pacific's plan are also based on the pervasiveness of poor performance.19 Specifically, the payment amounts increase as the percentage of statistically identified "failures" that exceed the number of "forgiven failures" increases. For example, if out of 100 results for a particular CLEC in one month there were twenty-two total identified failures with fourteen "forgiven" failures and eight "unforgiven" failures, the net failure percentage would be 9.3 percent.20 In this case, Pacific's plan would assess a $100 Tier I payment for each of the "unforgiven" eight failures. Id. at 12. In this same example, if there were twenty-three total identified failures, there would be nine "unforgiven" failures with a net failure percentage of 10.5 percent.21 With this outcome a $200 Tier I payment for each of the "unforgiven" nine failures would be assessed. Id. Payments range between $100 and $2000 per failure, depending on the degree of pervasiveness. The Pacific plan also assesses payments for repeated failures. Payments for three consecutive monthly ("chronic") failures range between $250 to $6000 and payments for six consecutive monthly ("extended chronic") failures range between $400 and $7000, depending on the degree of pervasiveness. Id.
Pacific does not explain how these dollar amounts were derived. However, Pacific presents an estimate of the economic impact of non-parity performance and asserts that the payment amounts generated by the plan exceed the economic impact of non-parity. For example, while Pacific's plan would assess a $497,900 total payment for year 2000 performance, which passed "just under 90%" of the sub-measures, Pacific estimates that the "upper bound" of economic harm to the CLECs for much worse performance would only be $219,080.22
Pacific proposes several conditions for applying a "conditional" 0.20 critical alpha level.23 The conditional alpha level would be used only for the monthly statistical tests that are used to identify Tier II assessments. Tier II assessments are limited to industry aggregate sample sizes of thirty cases or more that fail three consecutive months and exceed the permissible failure rate allowed by the mitigation provisions. Tier II payments range from $500 to $8000 per "unforgiven" failure depending on failure pervasiveness. Id. at 10-12.
B. CLEC Proposed Plan
The CLEC's proposed plan is documented in its May 11, 2001 filing in this proceeding.24 The CLEC's performance incentives plan has the same monthly payment cap as Pacific's. As noted in the above description of Pacific's plan, these amounts are approximately $46 million monthly and $550 million yearly.25 As with Pacific, the full payment amounts are not available without a formal review. In contrast to the Pacific plan, the CLEC plan would place a limit, or "procedural cap," only on Tier I payments that were neither severe nor chronic (repeated). The procedural cap would be $10 million total per month with no limit for individual CLECs. CLEC Plan at 20-21, (May 11, 2001).
In the CLEC's plan the ILECs would pay Tier I assessments to the CLECs, and Tier II assessments to a public fund. Similar to Pacific's plan, Tier I assessments are not adjusted by transaction volumes, and Tier II assessments are made by combining all CLEC results for each sub-measure to create an industry-wide assessment of sub-measure performance. However, in contrast to Pacific's Tier II proposals, payments can be assessed without repeated failures, and the smaller transaction volume sub-measures are not excluded. Also in contrast to Pacific's plan, the CLEC plan would adjust payments based on the severity of the performance "failure," although the CLEC plan does not use a direct measure of severity. The plan uses a method based on statistical failure probability estimates. Essentially, the CLEC plan interprets lower p-value statistical failures as more severe failures, based on the premise that as failure severity increases, the statistical test will produce lower p-values reflecting the decreased likelihood of severe occurrences under parity conditions. Id., at 7-8.
The CLEC's plan also "forgives" some statistically identified failures. While the stated "forgiveness" percentage is fifteen percent, it does not apply to aggregated small samples or to severe failures. As a consequence, the actual "forgiveness" percentage is not evident and must be calculated from the data. For example, if fifteen percent of the sub-measures were to fail and half the failures were severe, then the forgiveness rate would be 7.5 percent. Consequently, we cannot determine how this "forgiveness" mechanism compares to Pacific's ten-percent mechanism. However, as we discuss later in this decision, the relative impact of the different forgiveness mechanisms can be compared by examining the overall plan results as presented in Appendix B.
The CLECs propose that a 0.20 critical alpha be applied to small sample sizes. The application is limited by the condition that sample sizes do not reach 30 cases. The CLECs' intent was to increase test power where it is most needed, small samples. Apparently recognizing the congruent problem of too much power, the CLECs have offered to decrease test power for the industry-aggregate performance results (Tier II) by using a smaller critical alpha, 0.05. Id. at 5-7 and 16-17. The CLECs justify their Tier II smaller alpha by pointing out that industry-aggregates samples are likely to be larger than individual CLEC samples, and thus already have greater test power. Id. at 5.
C. Verizon's Proposed Plan
Verizon's proposed plan is documented in its May 4, 2001 filing in this proceeding.26 Verizon's performance incentives plan sets monthly payment caps for the first three years based on the Verizon (GTE-Bell Atlantic) merger conditions.27 Verizon's proposed annual maximum possible cap is $19.8 million the first year, $29.7 million the second year, and $39.6 million the third year. The monthly caps are one-twelfth of these amounts, 1.65 million, 2.475 million, and 3.3 million, for the respective years. In contrast to the Pacific and CLEC plans, the full payment amounts are available without a formal review.
In Verizon's plan the ILECs would pay Tier I and II assessments to the CLECs. In contrast to Pacific's plan, Tier I assessments are based on transaction volumes. Generally, payments are based on the number of CLEC customers who experience service worse than the average level for ILEC customers. Verizon's Tier II assessments are the same as Pacific's, except that Verizon specifies that payments go to the CLECs. Verizon Plan at 15-16.
The Verizon plan would adjust payments based on the severity of the performance "failure." Severity is determined by a similar metric as the one used to adjust payments by transaction volumes. The percentage of CLEC customers who experience service worse than the average level for ILEC customers determines severity. The severity calculation increases as the percentage of disadvantaged CLEC customers increases. Id. at 11-14.
Verizon's plan also "forgives" some statistically identified failures for Tier I results. Similar to Pacific's "F" value described earlier, Verizon has created a "K" table that specifies the number of permitted failures depending on the number of submeasure results for a CLEC in a month. The "K" table allows between about thirteen and twenty percent of the submeasure results to be "forgiven." For example, if a CLEC had fifteen submeasure results in one month, then three (twenty percent) could be forgiven if they failed. If a CLEC had 236 submeasure results in one month, then thirty (12.7 percent) could be forgiven if they failed. Id., App. D. at 32.
Verizon's plan also differs from the other plans in that it pays on a smaller set of performance measures. While other plans exclude some measures consistent with the Interim Opinion, Verizon excludes several additional measures because it views them as redundant or correlated to other paying measures. Id. at 4-7. Verizon's conditional 0.20 critical alpha proposal is the same as Pacific's except that Verizon specifies that Tier II payments would go to the CLECs, with no option for payment to a public fund as Pacific provides.
D. ORA's Proposed Plan
ORA's proposed plan is documented in its May 4, 2001 filing in this proceeding.28 Unlike the other parties, ORA's has not included payment caps in its performance incentives plan. ORA is concerned that payment caps can result in disincentives for good service:
"Payment caps not only cap payments, they also place a cap on service improvements. Service is effectively capped because both absolute and procedural caps provide the ILEC with an incentive to allow service to deteriorate once the cap is reached." ORA Plan at 11, (May 4, 2001).
In contrast to other plans, ORA's preferred plan would have the ILECs pay assessments primarily to individual ratepayers. ORA bases its payment distribution on the principle that payments should go to "the same entities (primarily business and residential ratepayers) who are paying for the infrastructure changes and upgrades that the ILECs assert were required to effectuate local exchange competition." Id. at 3. ORA's preferred plan would have the ILECs pay ninety-three percent of the assessments to individual ratepayers, one percent to the CLECs, and six percent to interexchange carriers (IECs). Id. at 4. ORA's plan does not have different tiers, as do the other plans. ORA's plan is entirely based on individual CLEC sub-measure results each month, similar to the Tier I structure of the other plans. Id. at 11.
Similar to Pacific's and the CLECs' plans, ORA's assessments are not adjusted by transaction volumes. Similar to the CLECs' plan, the ORA plan would adjust payments using statistical test outcomes as indirect performance "failure" severity measures. Id. at 11-12. In contrast to the other plans, ORA's plan does not forgive any statistically identified failures. Additionally, ORA's plan does not specify a conditional 0.20 critical alpha level. While ORA's plan lists a 0.20 alpha level, it gives no indication of when it is to be used. Id. at 7, 16-18, and 23-24.
11 These results were calculated by Pacific Bell and Verizon. Payments would go to the individual CLECs and to either the ratepayers or the State General Fund as discussed, infra. 12 Figure 2 projections were calculated without the log transformations that will be used in the actual plan. Logistical problems made retroactive data transformation prohibitively difficult for the earlier months in 2000; thus, only the last three months' data were transformed. Figure 1 shows the last three months with transformed data. Appendix B presents data that allows comparison of the last three months with and without transformations. Appendix B also provides charts of the payment amount data with aggregate failure rate data. 13 Pacific Bell Telephone Company's (U 1001 C) Submission of Performance Remedies Plan, ("Pacific Plan"), filed March 23, 2001. 14 Pacific's net return for local exchange service in the year 2000 was $1,527,942,000 Thirty-six percent of this amount is $550,059,120. Three percent of this net return amount is $45,838,260. See Appendix C (ARMIS 43-01 Cost and Revenue Table). 15 Pacific states that these optimal conditions would be: (1) all sub-measures operating at exact parity, (2) all the assumptions of the statistical tests are satisfied, and (3) all the sample sizes are large. Pacific Bell Telephone Company's (U 1001 C) Reply Comments on Commission's Initial Report on OSS Performance Results Replication and Assessment ("Pacific Repl. Comm. OSS Results"), July 6, 2001 at 5. 16 When performance is equal except for random variation. 17 At parity, one month might result in 11 percent failures, then next 9 percent failures, and so forth. Pacific's "F" table value represents the number of failures that could be expected under parity conditions, except for the highest ten percent of the time. For example, if out of one hundred monthly assessments under parity conditions we would expect statistically to fail greater than 15 percent of the measures less than ten percent of the time, then "F" would be set to 15 percent. 18 For the months October through December, 2000, Pacific performance averaged a statistical test failure rate of 9.6 percent, as illustrated in the Telecommunications Division's Initial Report on OSS Performance Results Replication and Assessment (Init. Rept. on OSS Perf.), June 15, 2001 at 18. More recent performance data obtained by staff from Pacific for May, 2001 shows a statistical test failure rate of 8.8 percent. 19 "Pervasiveness" refers to the extent of poor performance to a CLEC's customers. Pervasiveness is generally defined as the percentage of the total number of results that fail. 20 In this example, 22 failures exceed the 14 allowed failures by 8 failures, which represents 9.3 percent of the total results excluding the forgiven failures: (22 - 14)/(100 - 14) = .093, or 9.3 percent. 21 In the second example, 23 failures exceed the 14 allowed failures by 9 failures, which represents 10.5 percent of the total results excluding the forgiven failures: (23 - 14) /(100 - 14) = 0.105, or 10.5 percent. 22 Seventy percent pass rate. See Pacific Open. Comm., May 18, 2001 at 11-12. 23 In the Interim Decision we directed parties to propose conditions for using a 0.20 critical alpha level to increase test power. Interim Decision, January 18, 2001, at 147, Ordering Paragraph (OP) 14. Our use of the term "alpha level" refers to the probability that random variation would produce results identified as "failing" even though OSS processes were operating fairly. ("Failing" results refers to poorer OSS performance for CLEC customers as compared to ILEC customers.) For example, because of "the luck of the draw" (random variation), CLEC customers might receive longer phone service installation times even though there was no discrimination in any aspect of the ILECs' installation assignments, services, etc. The alpha level is a measure of a decision error, or Type I error. "Critical alpha level" refers to the maximum error that will be accepted in a decision. A statistical test calculates alpha probabilities for a performance result. Any result with an alpha probability that exceeds the critical alpha level (e.g., in this case, 0.22 would exceed the critical alpha level of 0.20) would not be deemed a performance "failure" even though actual performance to CLEC customers was worse than service to ILEC customers. On the other hand, any result with an alpha probability less that the critical alpha level (e.g., in this case, 0.18) would be deemed a performance "failure." In other words, in identifying performance as failing, we would only accept a twenty percent or less chance that random variation, and not actual discrimination, caused the poorer performance result. See also, Interim Decision, January 18, 2001, at 59-69 and 70. 24 Revisions to Participating Competitive Local Exchange Carriers' Performance Incentives Plan, ("CLEC Plan"), filed May 11, 2001. 25 The CLECs' calculations were based on 1999 data. CLEC Plan, May 11, 2001 at 12. The calculations here are based on 2000 data as listed in Appendix C. 26 Revised Interim Verizon Performance Plan for the State of California, ("Verizon Plan"), filed May 4, 2001. 27 Re GTE Corporation and Bell Atlantic Corporation, Application for Consent to Transfer Control, etc, FCC 00-221, CC Doc. No. 98-184, Memorandum Opinion and Order, June 16, 2000, Attachment A-6, p. A-6-1; as cited in Verizon Plan at 9, (May 4, 2001). 28 Updated Interim Incentive Model, ("ORA Plan"), filed May 4, 2001.


